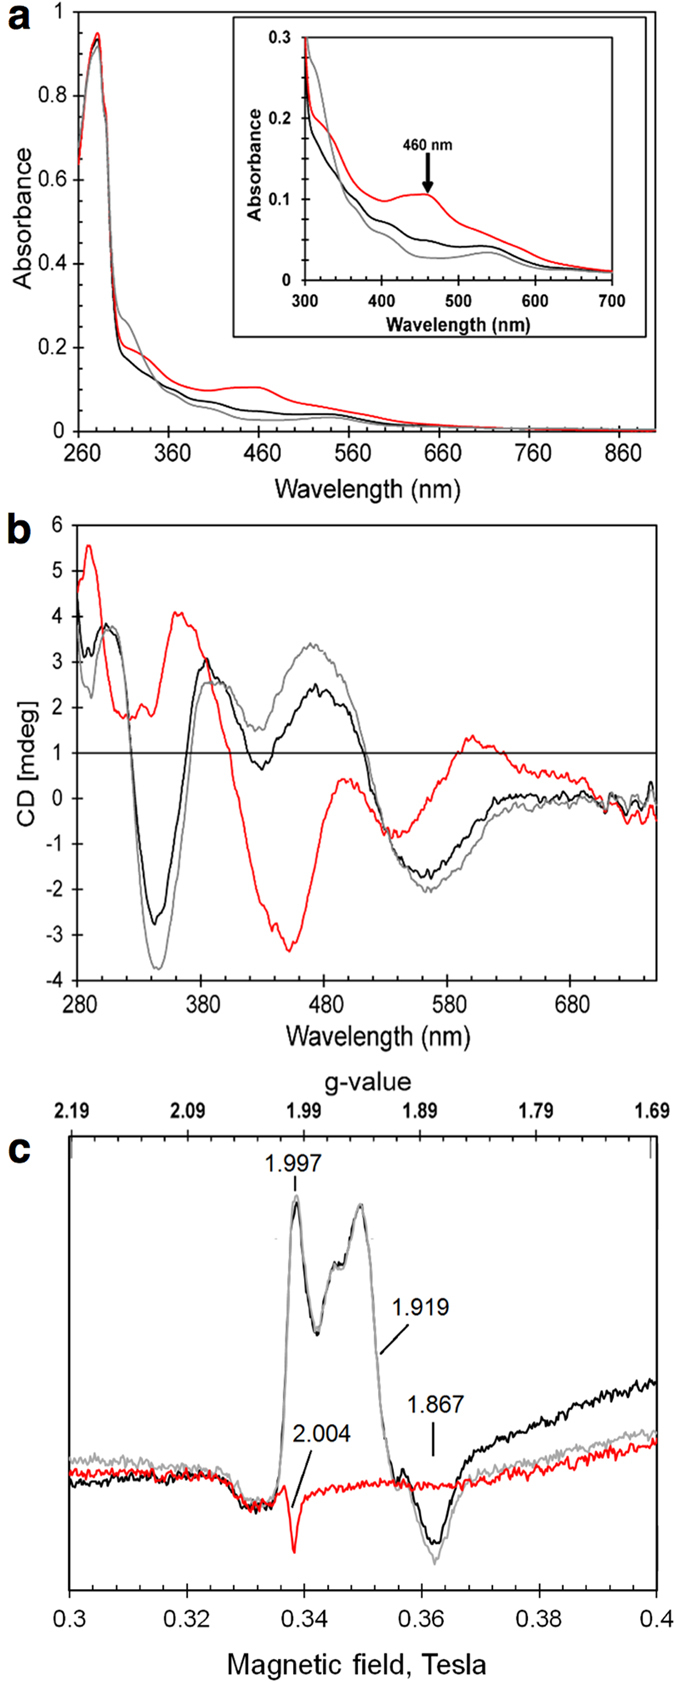
Figure 2. Spectroscopic characterization of RsrR.

UV-visible absorption (a), CD (b) and EPR spectra (c) of 309 μM [2Fe-2S] RsrR (~75% cluster-loaded). Black lines – as isolated, red lines – oxidised, grey lines reduced proteins. In (a,b), initial exposure to ambient O2 for 30 min was followed by 309 μM sodium dithionite treatment; in (c) – as isolated protein was first anaerobically reduced by 309 μM sodium dithionite and then exposed to ambient O2 for 50 min. A 1 mm pathlength cuvette was used for optical measurements. Inset in (a) shows details of the iron-sulfur cluster absorbance in the 300–700 nm region.
