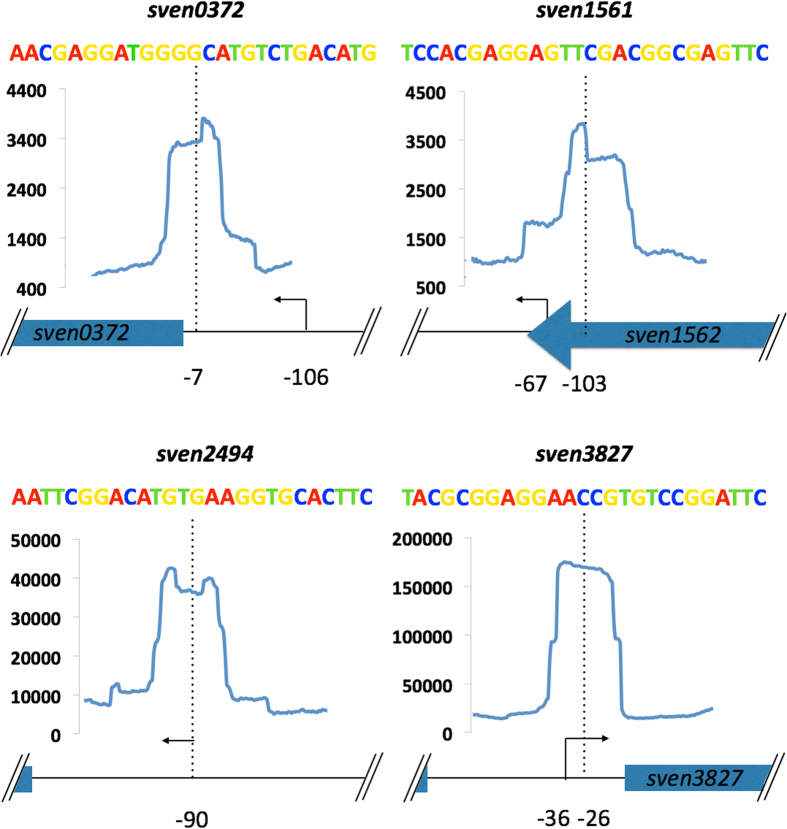
Figure 6. Graphical representation of combined ChIP-Seq, ChIP-exo and dRNA-seq for four class 1 targets.
Each target has the relative position of ChIP-exo (blue line) peak centre (dotted line) and putative transcriptional start site (TSS - solid arrow) indicated with the distance in bp (black numbers) relative to the down stream start codon of target genes. The y-axis scale corresponds to number of reads for ChIP data with each window corresponding to 200 bp with each ChIP-peak being ~50 bp wide. Above each is the relative binding site sequence coloured following the weblogo scheme (A – red, T – green, C – blue and G – yellow) from the MEME results.

