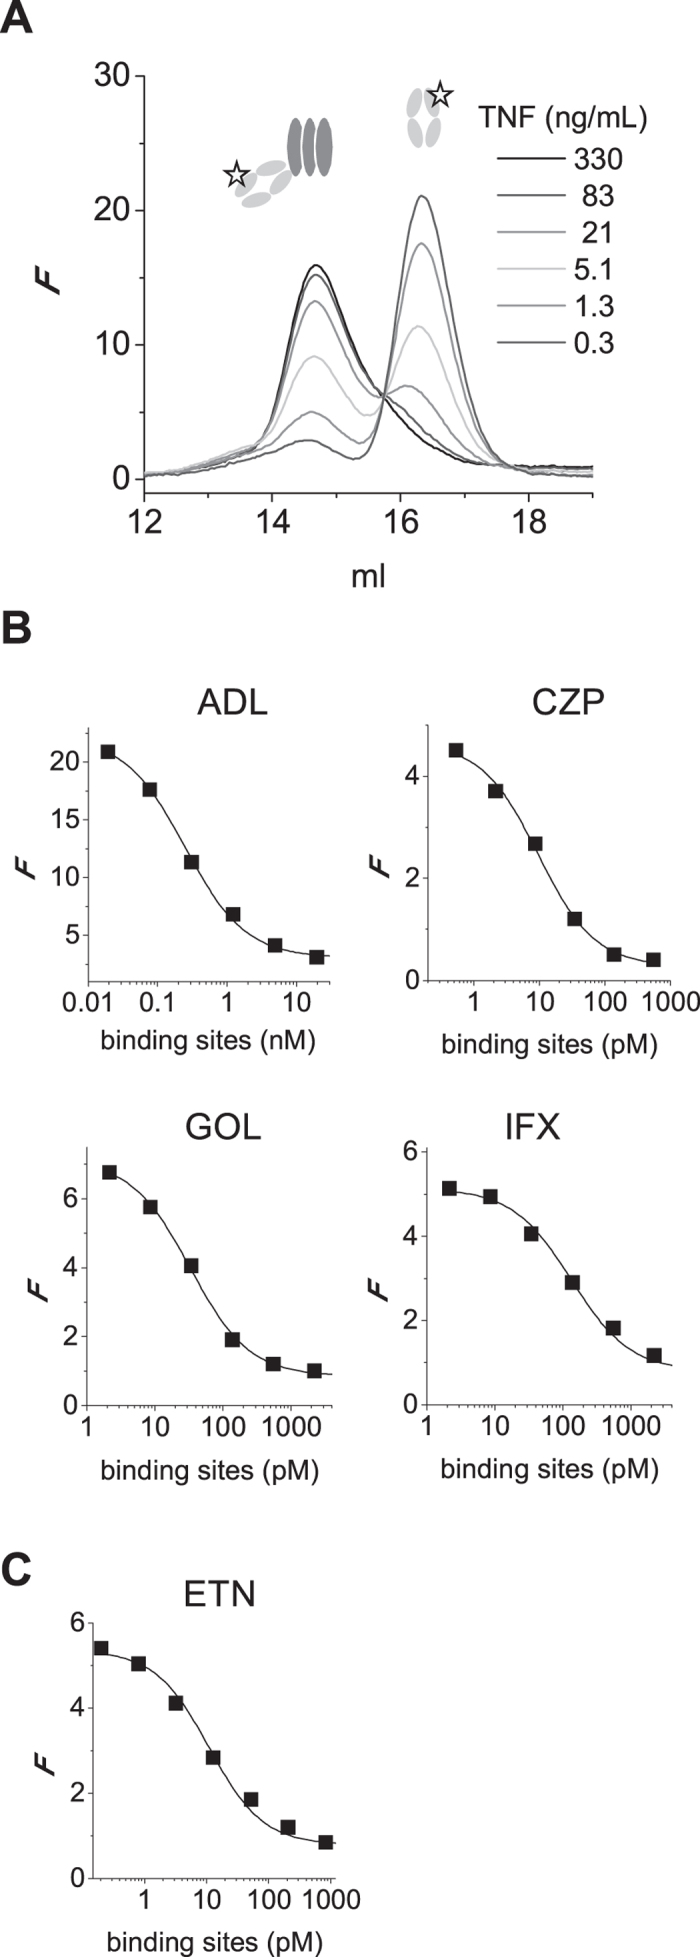
Figure 5. Affinities of TNF inhibitors in fluid phase.

(A) Example of fluid-phase affinity measurement of TNF-anti-TNF. DyLight-488 labeled adalimumab Fab’ is incubated with different concentrations of TNF and analyzed by HP-SEC, monitoring the elution of bound and free adalimumab Fab’-488 by in-line fluorescence detection. (B) Free Fab-488 is plotted vs the concentration of TNF (molar concentration of binding sites) and a 1:1 Langmuir binding model is fitted, thus assuming independent association of anti-TNF Fab’s to each binding site on TNF. (C) TNF-488 was incubated with different concentrations of etanercept and analyzed analogously to B, using the molar concentration of etanercept in the calculations. Representative of n = 3. F = fluorescence.
