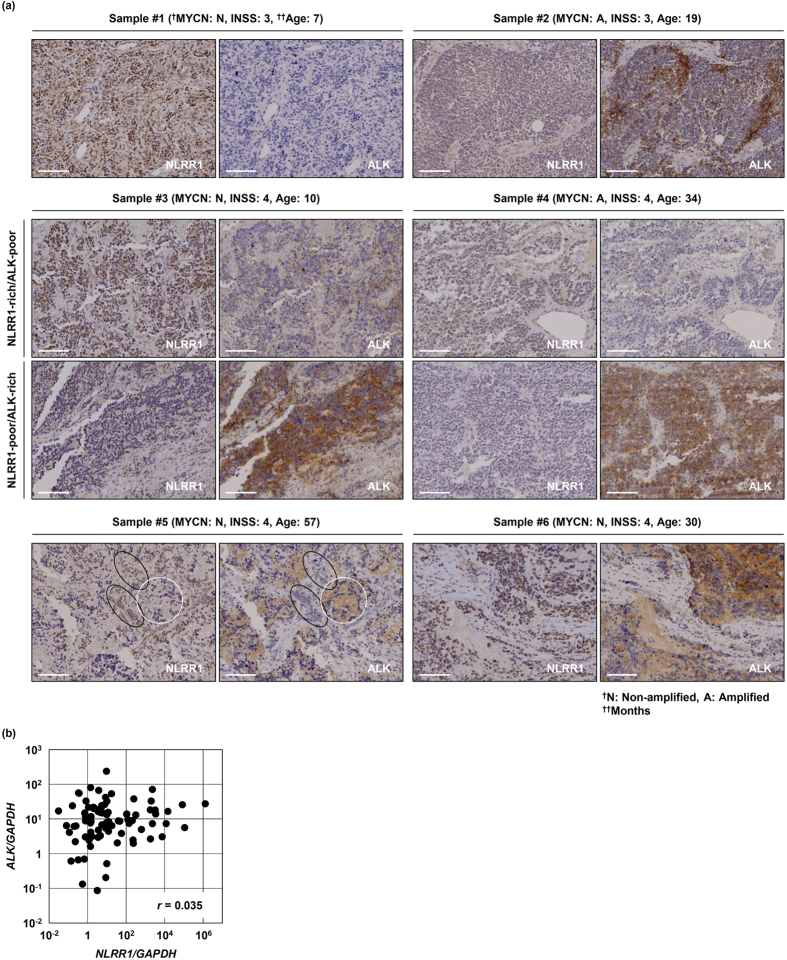
Figure 1. NLRR1 and ALK show mutually exclusive expression in human NB.
(a) Expression patterns of NLRR1 and ALK were often mutually exclusive in immunohistochemical analysis. Black and white circles indicate NLRR1-rich/ALK-poor and NLRR1-poor/ALK-rich cancer cell clusters, respectively. Bars: 100 μm. (b) The expression level of NLRR1 was not correlated with that of ALK in qPCR analysis. The correlation was evaluated by Pearson’s test.

