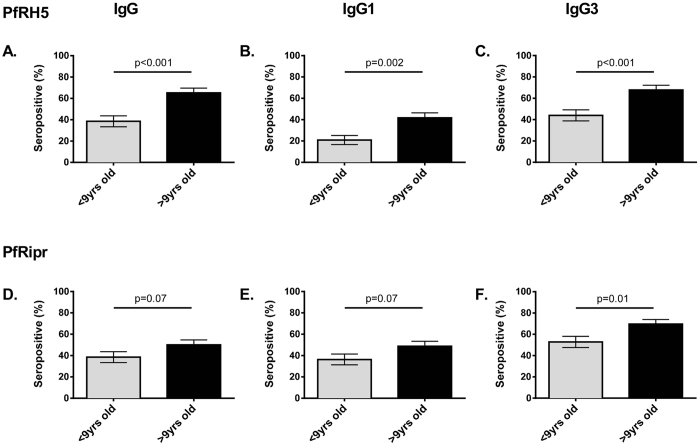
Figure 2. Seroprevalence of total IgG and subclass response to PfRH5 and PfRipr by age.
IgG seroprevalence to PfRH5 and PfRipr recombinant proteins measured by ELISA. Results are shown as percentage seropositive.. Error bars indicate standard error of proportion (SE). Results are shown by Age (<9 or >9 years of age). Top row: PfRH5. Bottom row: PfRipr. Results are shown for (A)/(D) Total IgG, (B)/(E). IgG1 and (C)/(F) IgG3 left to right. P values indicate chi square test.

