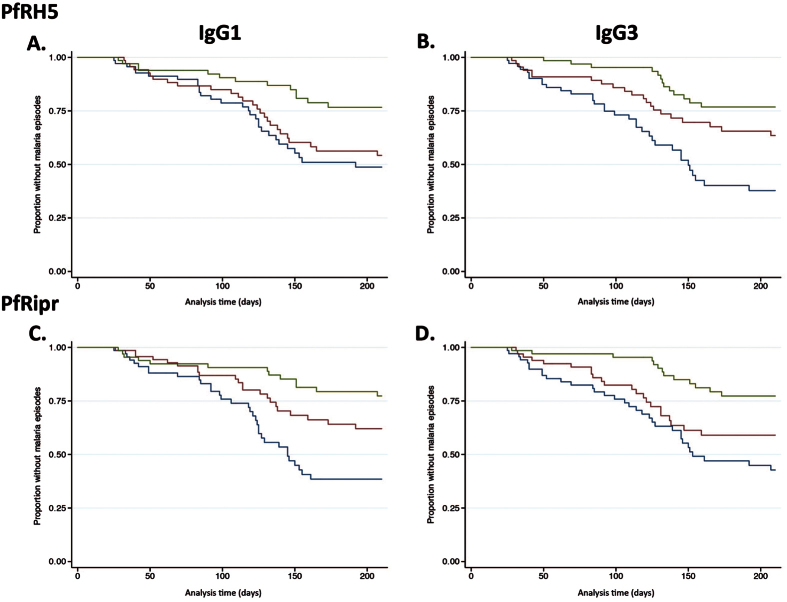
Figure 4. Risk of symptomatic P. falciparum episode during follow-up relative to IgG1 and IgG3 to PfRH5.
Kaplan-Meier curves show the proportion of children that remained free of malaria episodes over time for IgG subclass responses against PfRH5 and PfRipr (A) IgG1 to PfRH5; (B) IgG3 to PfRH5; (C) IgG1 to PfRipr; (D) IgG3 to PfRH5. Antibody responses were divided into 3 equal response groups: high (green line), medium (red line), and low (blue line) antibody reactivity. Unadjusted data are shown. Wilcoxon log rank tests were carried out: (A) p = 0.004; (B) p < 0.001; (C) p < 0.001; (D) p < 0.001 Symptomatic P. falciparum infection was defined as fever (>37 °C) plus a parasite load of 5000 parasites/μl.

