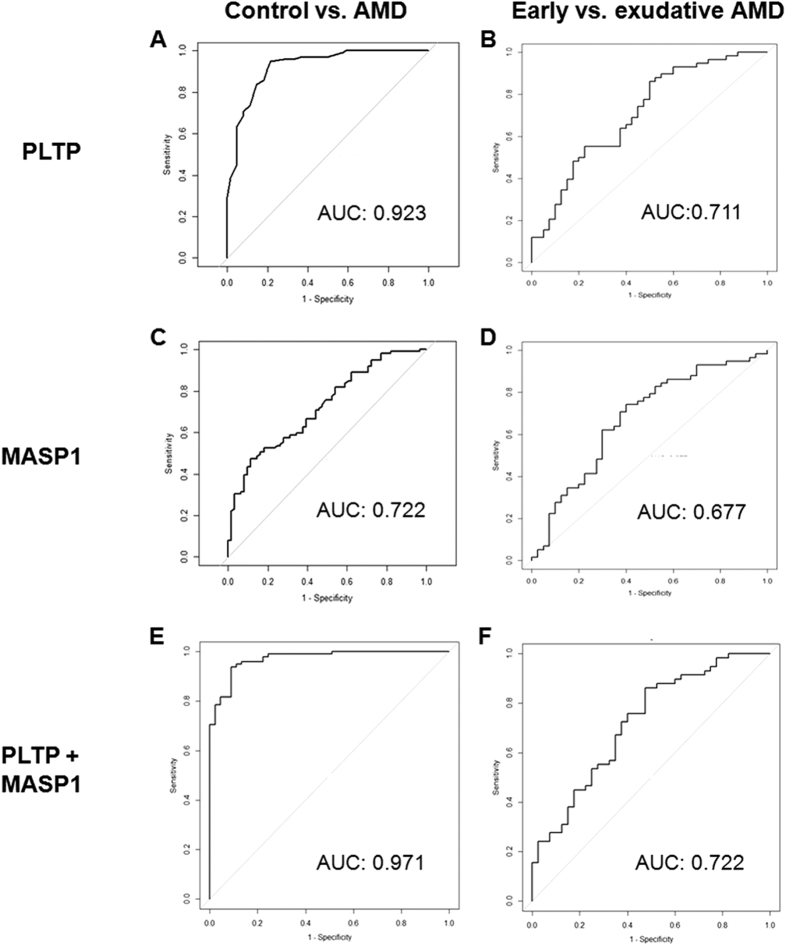
Figure 4. ROC curve of plasma PLTP and MASP-1 levels for detection of early and exudative AMD.
AUC values of ROC curves were (A) 0.923 for PLTP, (C) 0.722 for MASP-1, and (E) 0.971 for the two proteins combined between AMD patients and healthy control (HCs). AUC values of ROC curves were (B) 0.711 for PLTP, (D) 0.677 for MASP-1, and (F) 0.722 for the two proteins combined between patients with early and exudative AMD.

