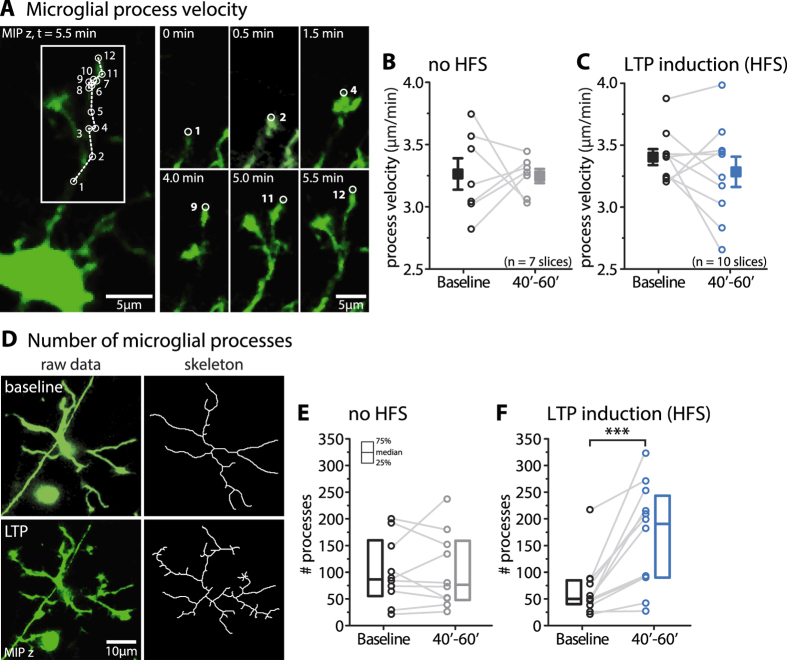
Figure 2. LTP induction increases the number, but not the velocity, of microglial processes.
(A) Example of a tracked microglial process. The cumulative MIP is a projection over 12 consecutive time points, in which the microglial process tip was tracked over time (left panel, white circles). The magnified insets show the process tip at different time points (right panel). (B,C) The average velocity of microglial processes did not change over time in the absence of HFS (B) (baseline: 3.26 ± 0.13 μm/min; 40′–60′: 3.25 ± 0.06 μm/min; mean ± sem, paired t-test, p = 0.92, n = 7 slices) and after LTP induction (C) (baseline: 3.40 ± 0.07 μm/min; 40′–60′: 3.28 ± 0.12 μm/min; mean ± sem, paired t-test, p = 0.30, n = 10 slices). (D) MIP of a microglia in baseline and LTP conditions (left column) and the corresponding skeletons (right column). (E,F) Quantification of the number of processes per microglia in the absence of HFS (E) (baseline: median 86.5 [55.25, 159.75]; 40′–60′: median 76.5 [48.0, 159.0]; median [25th and 75th percentile], Wilcoxon paired test, p = 0.85, n = 10 cells/7 slices). Microglia increased the number of their processes upon LTP induction (baseline: median 50.0 [40.25, 84.75]; 40′–60′: median 190.5 [90.0, 243.5]; median [25th and 75th percentile], Wilcoxon paired test, p = 0.0004, n = 12 cells/9 slices).

