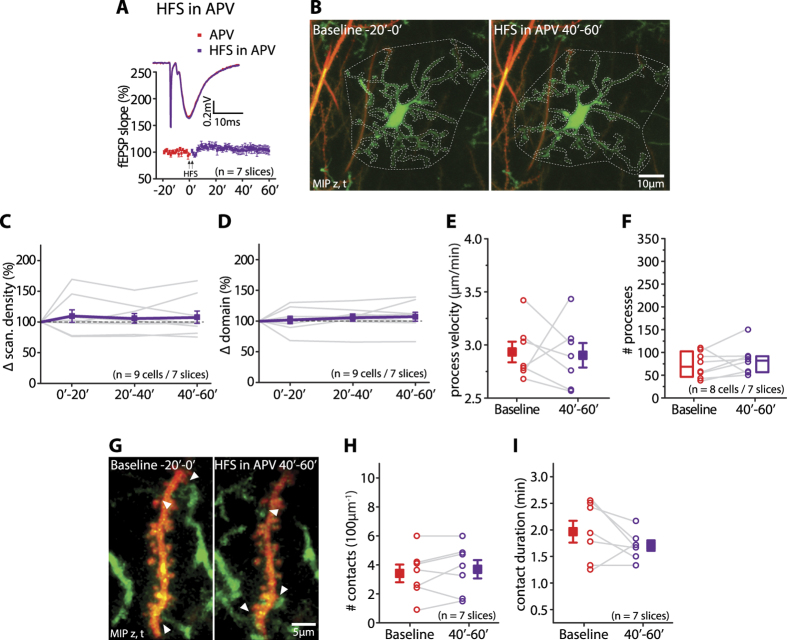
Figure 4. NMDAR antagonist APV prevents HFS-induced changes in microglial morphological dynamics and microglia-spine interactions.
(A) Normalized fEPSP slope in the presence of APV during baseline (red) and after the HFS (purple), showing the suppression of LTP (n = 7 slices). The inset presents average fEPSPs traces in the presence of APV during the baseline (red) and 40–60 min after the HFS (purple). (B) Cumulative MIPs over 20 min in the presence of APV showing that the scanning density and domain 40–60 min after application of the HFS (right) were similar to its baseline conditions (left). (C,D) Scanning density (C) (repeated measures Anova, factor of time: p = 0.63; n = 9 cells/7 slices) and domain (D) (repeated measures Anova, factor of time: p = 0.5; n = 9 cells/7 slices) in the presence of APV did not change after the HFS. (E,F) In the presence of APV process velocity (E) (baseline: 2.93 ± 0.1 μm/min; 40′–60′: 2.9 ± 0.12 μm/min; mean ± sem, paired t-test, p = 0.83, n = 7 slices) and the number of processes (F) (baseline: median 68.5 [46.25, 102.25]; 40′–60′: median 82.0 [56.5, 91.5]; median [25th and 75th percentile], Wilcoxon paired test, p = 0.2, n = 8 cells/7 slices) remained unaffected by HFS. (G) Cumulative MIPs showing the number of microglia-spine contacts in the presence of APV during the baseline (3) and after the HFS (3, 40′–60′). (H,I) Application of the HFS in the presence of APV did not change the number of contacts (H) (baseline: 3.4 ± 0.6; during 40′–60′: 3.6 ± 0.6; mean ± sem, paired t-test, p = 0.32, n = 7 slices) nor their duration (I) (baseline: 2 min ± 0.2 min; during 40′–60′: 1.7 min ± 0.1 min; p = 0.16, n = 7 slices).

