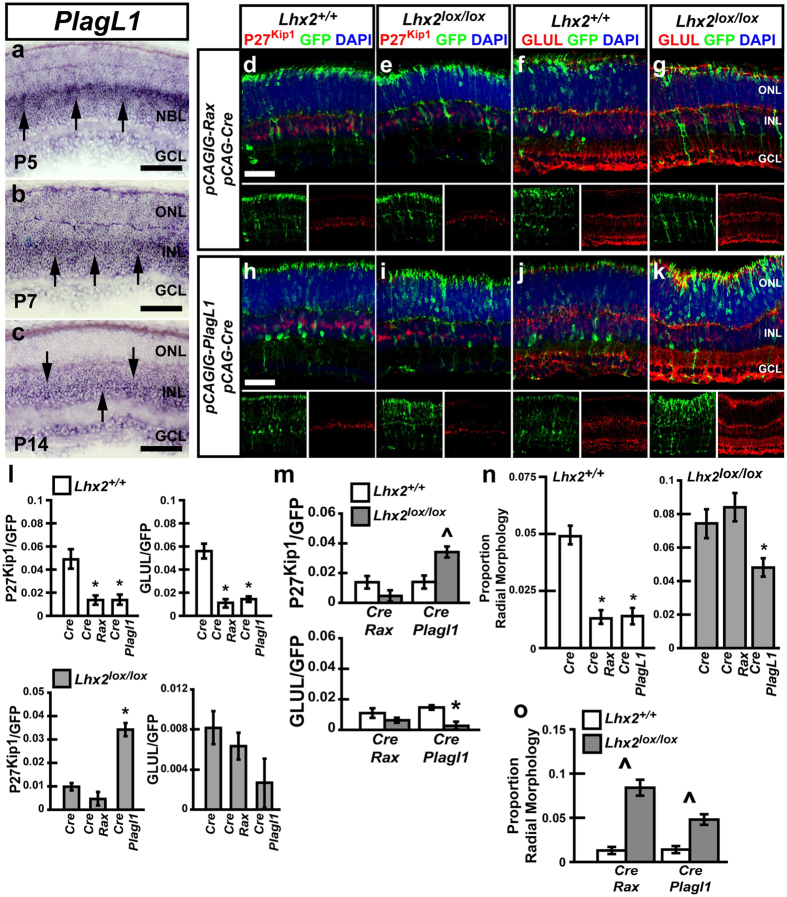
Figure 3. Electroporation of Rax both blocks MG development and fails to rescue the loss of MG resulting from Lhx2 loss of function, whereas Plagl1 blocks MG development but is sufficient to rescue P27Kip1 expression resulting from Lhx2 loss of function.
(a–c) In situ hybridization of Plagl1 at P5, P7, and P14. Arrows show regions of Plagl1 RNA enrichment. (d–g) Electroporation of Lhx2+/+ and Lhx2lox/lox retinas with Cre/GFP/Rax and analyzed by immunohistochemical co-labeling of GFP with the MG markers P27Kip1 and GLUL. (h–k) Electroporation of Lhx2+/+ and Lhx2lox/lox retinas with Cre/GFP/Plagl1 and analyzed by immunohistochemical co-labeling of GFP with P27Kip1 and GLUL. (l,m) Quantification of GFP/P27Kip1 and GFP/GLUL co-labeled cells in Lhx2+/+ and Lhx2lox/lox mice following Cre/GFP, Cre/GFP/Rax or Cre/GFP/PlagL1 electroporation. (n,o) Quantification of radial cells in Lhx2+/+ or Lhx2lox/lox mice following Cre/GFP, Cre/GFP/Rax or Cre/GFP/PlagL1 electroporation. *Indicates significant decrease while ^ indicates significant increases (P < 0.05, N = 6 for marker counts, N = 12 for radial morphology counts). NBL, neuroblastic layer. Scale bars: 100 μm (a–c), 50 μm (d,h).

