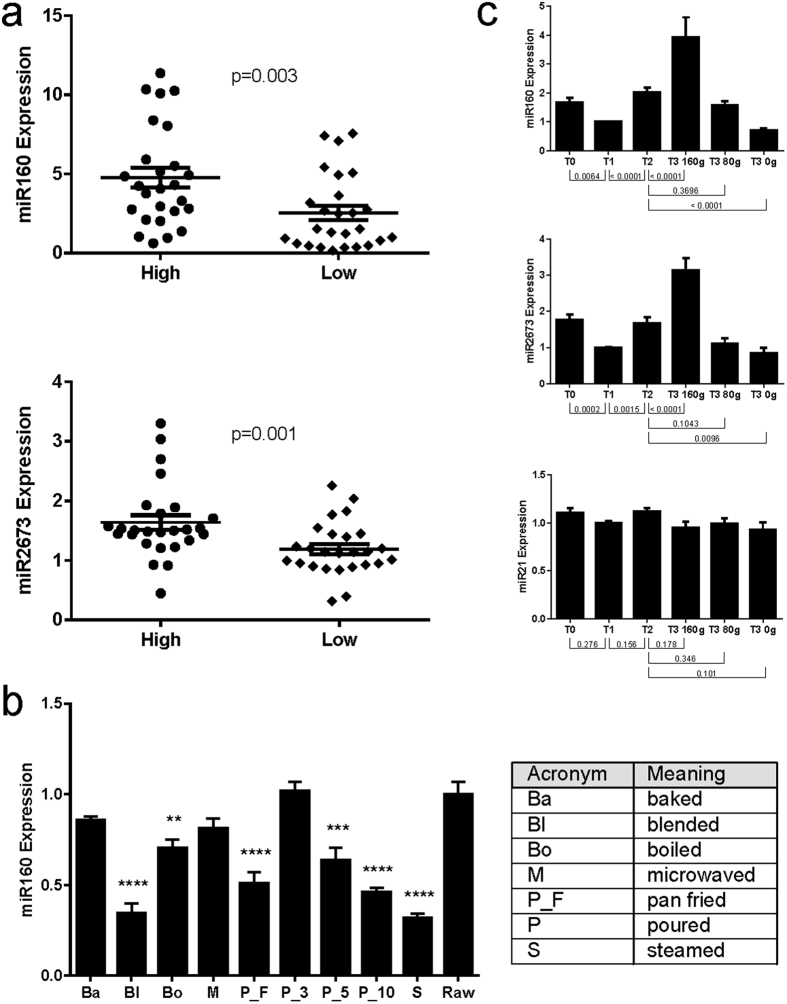
Figure 2. Detection of miR160 and miR2673.
(a) Amount of microRNA detected in sera collected in an epidemiological study, comparing persons eating a high amount (at least one serving, i.e., 80 g) or a low amount (0 servings) of Brassicaceae per day. p-values from ANOVA are shown. (b) Expression of miR160 in cooked broccoli samples. Broccoli was cooked using 7 different techniques, and in one case (poured) using three different time points (3 minutes P_3, 5 minutes P_5 and 10 minutes P_10). Expression was normalized to raw broccoli. p-values (ANOVA): **0.01–0.001, ***0.001–0.0001, ****<0.0001. (c) Expression in plasma of individuals eating no Brassicaceae (T1 and T3 0 g), 80 g of broccoli per day (T2 and T3 80 g), 160 g of broccoli per day (T3 160 g). p-values were calculated using the Mann Whitney test.

