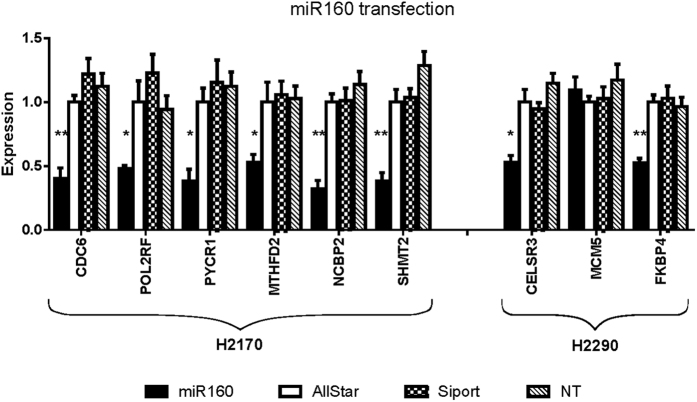
Figure 3. Effect of miR160 transfection on targets expression.
Ratio of expression of tested genes after transfection of miR160 in two NSCLC cell lines compared to expression in negative control (AllStars, scrambled sequence). siPORT = transfection reagent. NT = not treated. p-values (t-test): *0.05–0.01, **0.01–0.001.

