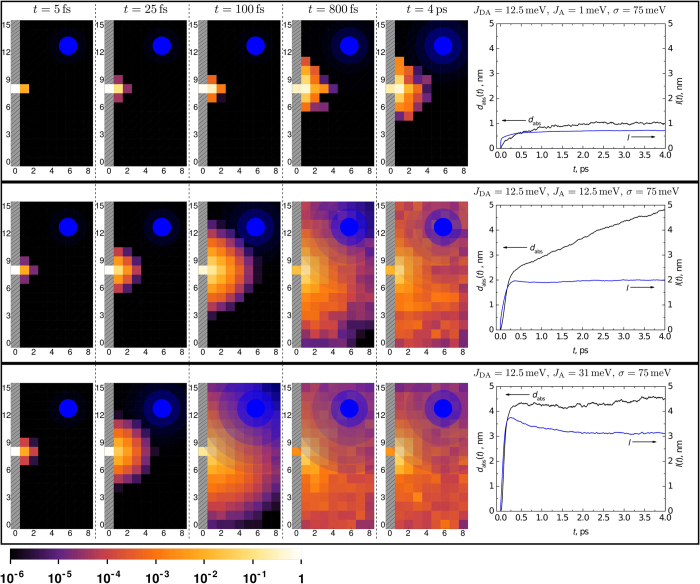
Figure 1. Ensemble-averaged evolution of electron probability density in the plane perpendicular to the donor (grey area) and acceptor (8 × 16 × 16 nm3 domain) interface at different times following photoexcitation for the indicated values of inter-acceptor coupling JA.
The rightmost column shows the corresponding absolute charge separation distance dabs(t) (black traces) and delocalization radius l(t) (blue traces). Filled blue circles illustrate the extent of electron coherence at a given time. The color scale at the bottom describes the probability of finding the electron at the indicated distance from the interface.

