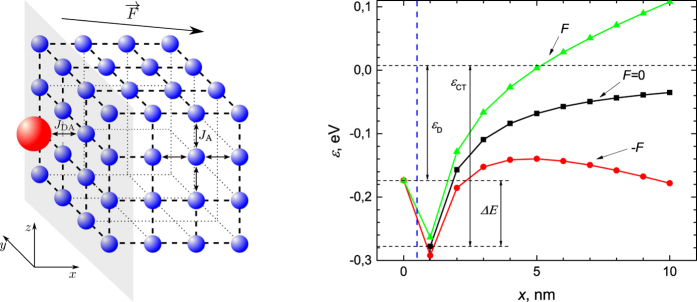
Figure 4. Model description.
(a) Schematic of the donor - acceptor interface model. Red sphere denotes the donor site; blue spheres denote the acceptor sites; F denotes the arbitrary direction of the external electric field reflecting the averaging procedure over all possible CT interface orientations with respect to F, see the main text; JDA and JA denote the interaction energies between the donor and the nearest acceptor site and between the nearest neighbor acceptor sites respectively. (b) Energy profile in the direction perpendicular to the donor/acceptor interface plane (dashed blue line), parameter values are given in the Supplementary Information. The red and green curves represent the shift of the Coulomb potential due to the applied external electric field  , the black curve - the shifted Coulomb potential when a net zero electric field is applied. The donor site corresponds to x = 0. εD is the donor site excitation energy, εCT denotes the state energy of the CT exciton and ΔE is the driving force.

