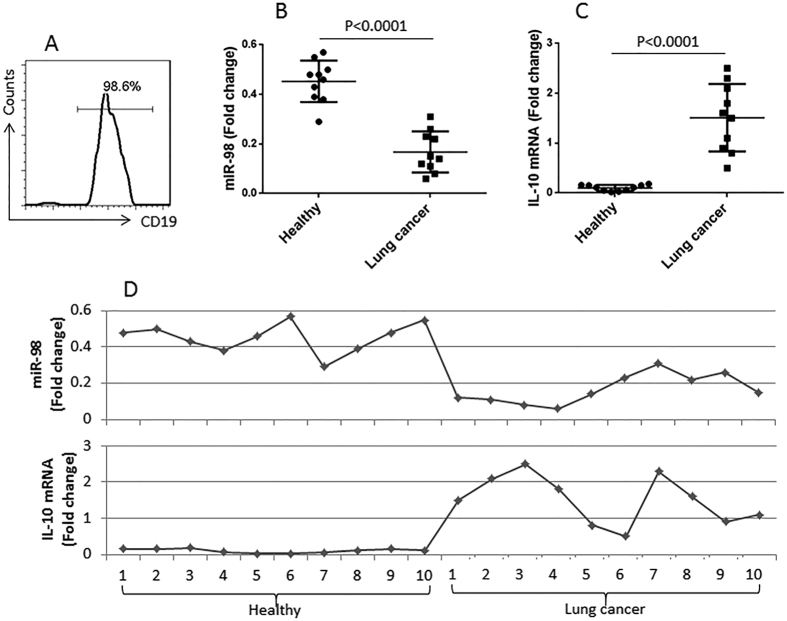
Figure 2. Assessment of miR-98 and IL-10 mRNA in peripheral B cells.
(A) the histogram shows the purity of B cells isolated from PBMCs, which were isolated from the peripheral blood samples collected from healthy subjects (n = 10) and patients with lung cancer (n = 10). (B,C) the dispersed dot plots show the levels of miR-98 (B) and IL-10 mRNA in the isolated peripheral B cells. (D) the curves show the correlation of individual data between miR-98 and IL-10.

