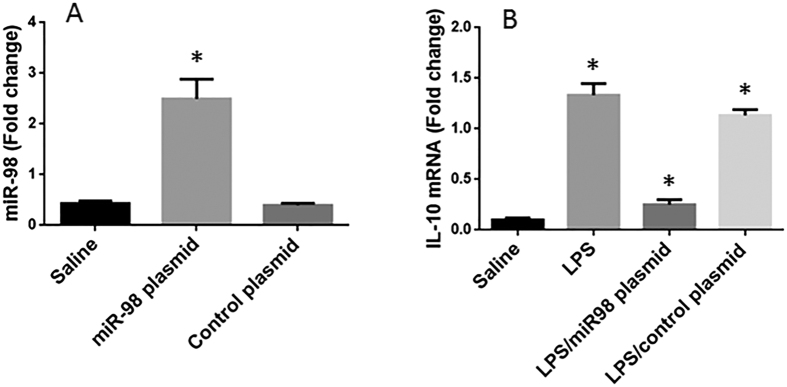
Figure 3. MiR-98 inhibits IL-10 expression in B cells.
B cells were collected from healthy subjects. (A) the bars indicate the miR-98 levels in B cells after treatment with saline or miR-98 plasmids or control plasmids. (B) the bars indicate the IL-10 mRNA in the B cells after the treatment denoted on the X axis. Data of bars are presented as mean ± SD. *p < 0.01, compared with the saline group. The data were summarized from 3 independent experiments.

