
Figure 2. Survival, colony-forming, and cell invasion assays.
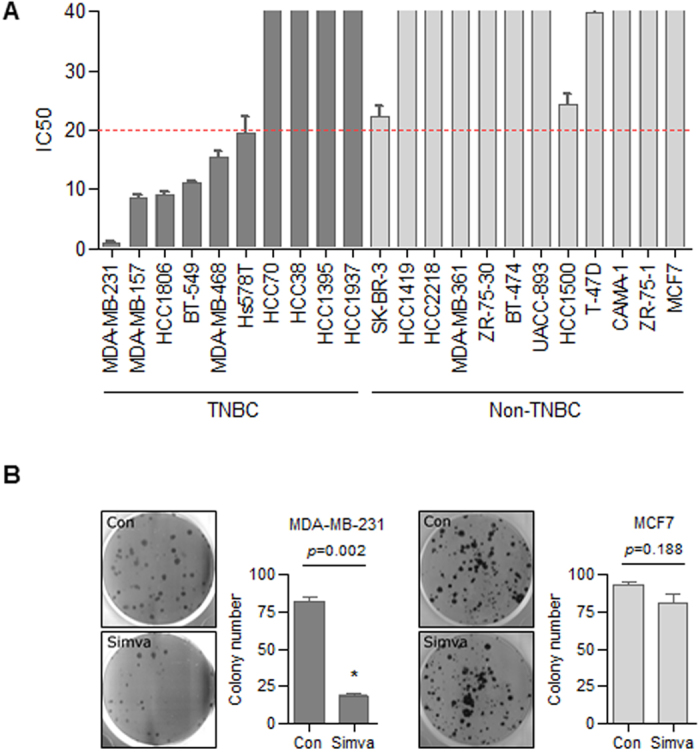
(A) IC50 values for a panel of BC cell lines treated with simvastatin. Proliferation was assessed 3 days after treating BC cell lines with varying concentrations (0–120 μmol/L) of simvastatin. Dose-response curves were used to calculate the IC50 values. Values are shown are means of three independent experiments. IC50 values less than 20 μmol/L (denoted by the red dashed line) indicate a potential therapeutic effect of simvastatin. White columns, TNBC cells; gray columns, HER-2-positive cells; black columns, hormone receptor-positive cells. (B) Colony-forming assays of TNBC (MDA-MB-231) and ER-α-expressing (MCF 7) cells. Cells were treated with 0.1 μM simvastatin for 3 days and maintained at 37 °C for 14 days. Fresh medium was added after 7 days. Cells were stained with 0.1% crystal violet.