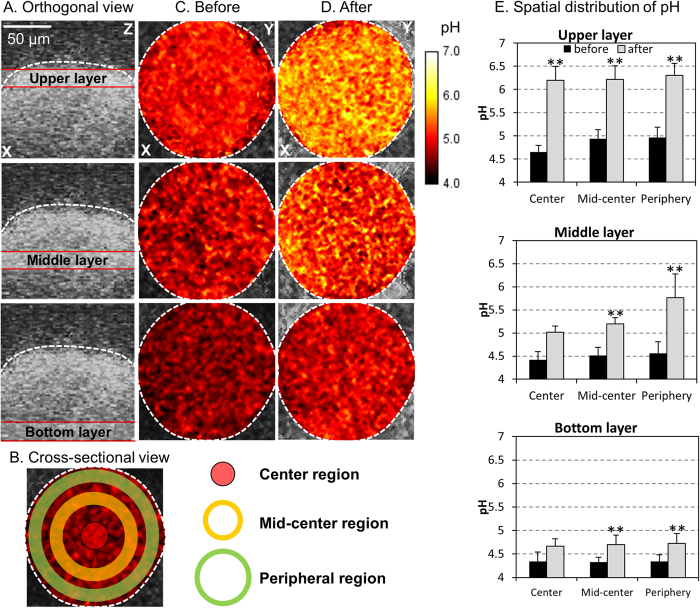
Figure 2. Spatial pH distribution within an intact microcolony.
(A) Orthogonal and (B) cross-sectional sections within the microcolony, which were divided as follows: upper-, middle- and bottom-layer as well as center-, mid-center- and peripheral-region. (C) pH distribution at each orthogonal sections before and (D) after incubation in neutral pH buffer. (E) pH values at each layer and each section of the microcolony. This figure indicates persistence of acidic pH between the bottom and lower-middle layers of the microcolony despite exposure to neutral pH buffer. Double asterisk indicates that the values are significantly different from each other (P < 0.01).

