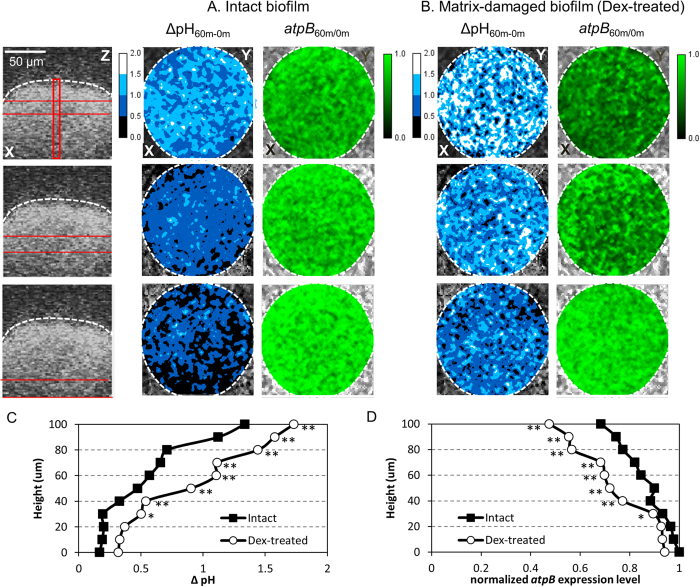
Figure 7. Relationship of spatial pH distribution and atpB gene expression within the microcolony.
. Cross-sectional distributions of pH and atpB expression levels at each selected section (red bars) within (A) intact and (B) dextranase (Dex)-treated microcolonies. We measured pH values and atpB expression level before (0 min) and after (60 min) exposure to neutral buffer. The results were presented as ΔpH (C) and fold-change atpB expression (D) (between 60 min and 0 min). The symmetric (‘mirror-image’) plots of pH (C) and atpB (D) from intact and Dex-treated microcolonies indicate that S. mutans residing within the 3D structure is actively responding to local microenvironmental changes. Asterisk (P < 0.05) and double asterisk (P < 0.01) indicate that the values for the different experimental groups are significantly different from each other.

