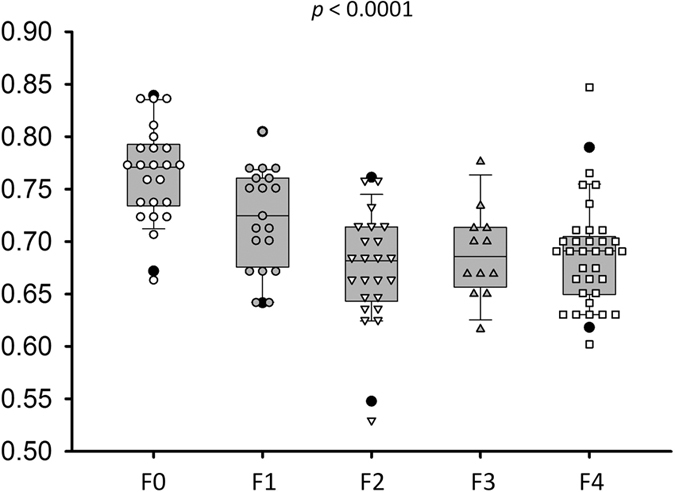
Figure 4. The Nakagami parameters corresponding to each liver fibrosis stage.

Data are expressed using box plots. The Nakagami parameter decreased with an increase in the histological fibrosis stage, representing an increase in the degree of pre-Rayleigh statistics for the echo amplitude distribution.
