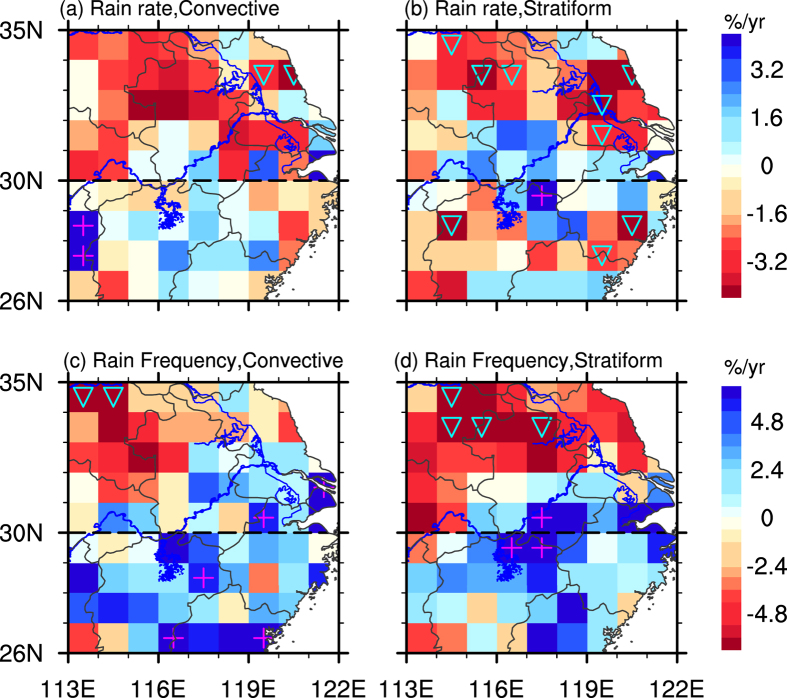
Figure 2.
Spatial patterns of trends in normalized rain rate (a,b) and rain frequency(c,d) for convective (left panel) and stratiform (right panel) precipitation at 1° × 1° resolution over EC during summer of 2002 to 2012. Triangle/plus shows the negative/positive trends statistically significant at the 90% confidence level. Maps were generated in NCL42.

