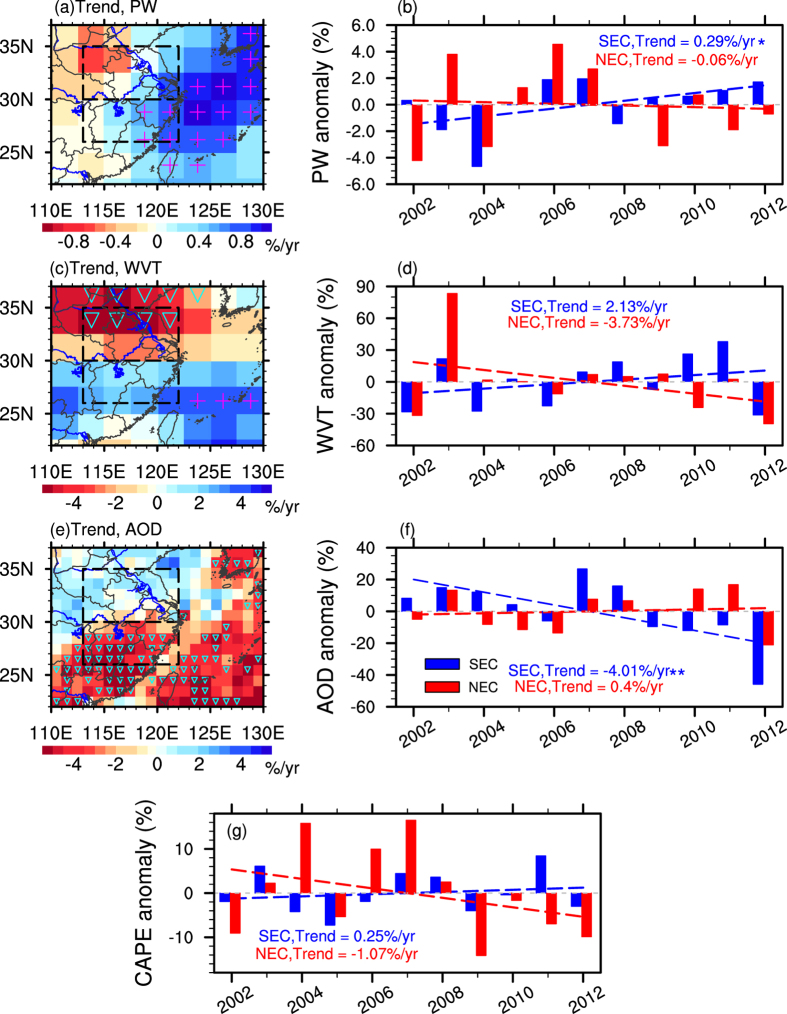
Figure 4.
The spatial pattern of trends in normalized anomalies of PW (2.5° resolution) (a), WVT from 700 hPa to 500 hPa (2.5° resolution) (b), and AOD (1° resolution) (e) and the area-averaged time series of annual normalized anomalies (%) of PW (b), WVT in the 700 hPa to 500 hPa layer (d), AOD (f), and CAPE (g). Triangle/plus shows the negative/positive trends statistically significant at the 90% confidence level. Red (blue) dashed lines denote linear trends in NEC (SEC). ‘**’ and ‘*’ denote statistically significant at the 95% and 85% confidence level, respectively. Maps were generated in in NCL42.

