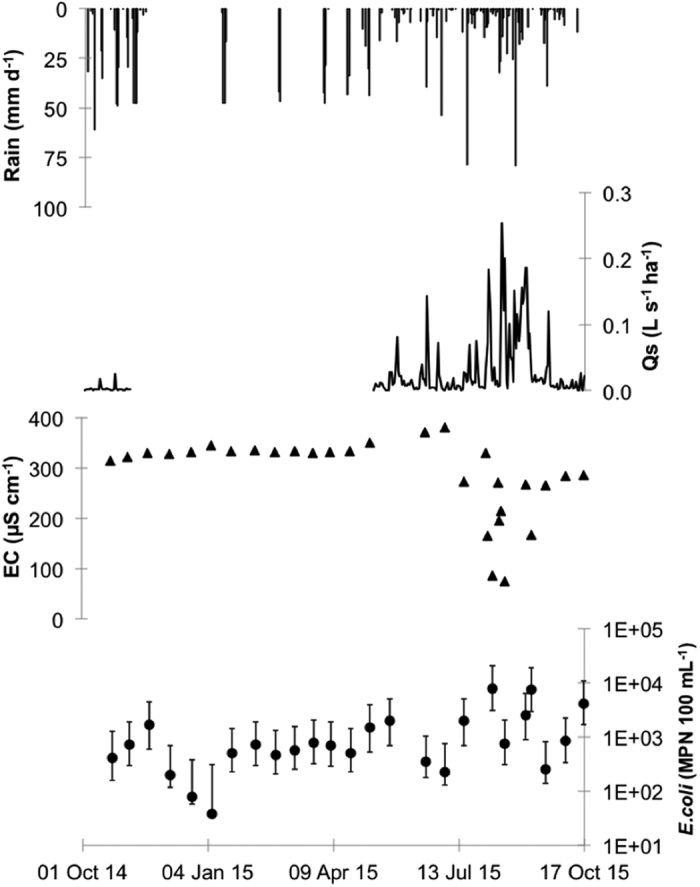
Figure 5. Baseflow (inter-storm) and stormflow in the Huay Ma Nai catchment, Thailand.

Rainfall intensity (daily time step; mm d−1); stream specific discharge (Qs, L s−1 ha−1); electrical conductivity (EC, μS cm−1); total suspended solids (TSS, g L−1); E. coli concentration in the stream (E. coli, MPN 100 mL−1). Black filled symbols: baseflow samples, grey filled symbols: stormflow samples.
