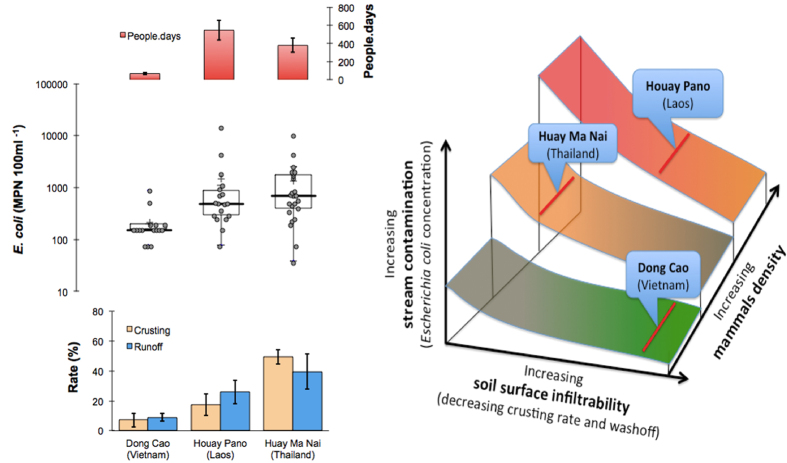
Figure 7. Escherichia coli (E. coli), soil surface infiltrability and mammalian presence in the studied catchments.
Concentrations of E. coli in streamwater during baseflow (Dong Cao ≠ Houay Pano = Huay Ma Nai; p < 0.05), soil surface crusting rate (Dong Cao < Houay Pano < Huay Ma Nai; p < 0.05), runoff (Dong Cao < Houay Pano < Huay Ma Nai; p < 0.05), and people.days (Dong Cao < Huay Ma Nai < Houay Pano; p < 0.05) as a proxy of mammalian density (left side panel). Conceptual diagram showing the relationship between mammalian density, soil surface infiltrability and stream E. coli loads (right side panel). Each of the three studied catchments is placed on the graph as indicated by a red line. A change in either soil infiltrability or mammalian density would result in a change in the position along and across the different zones.

