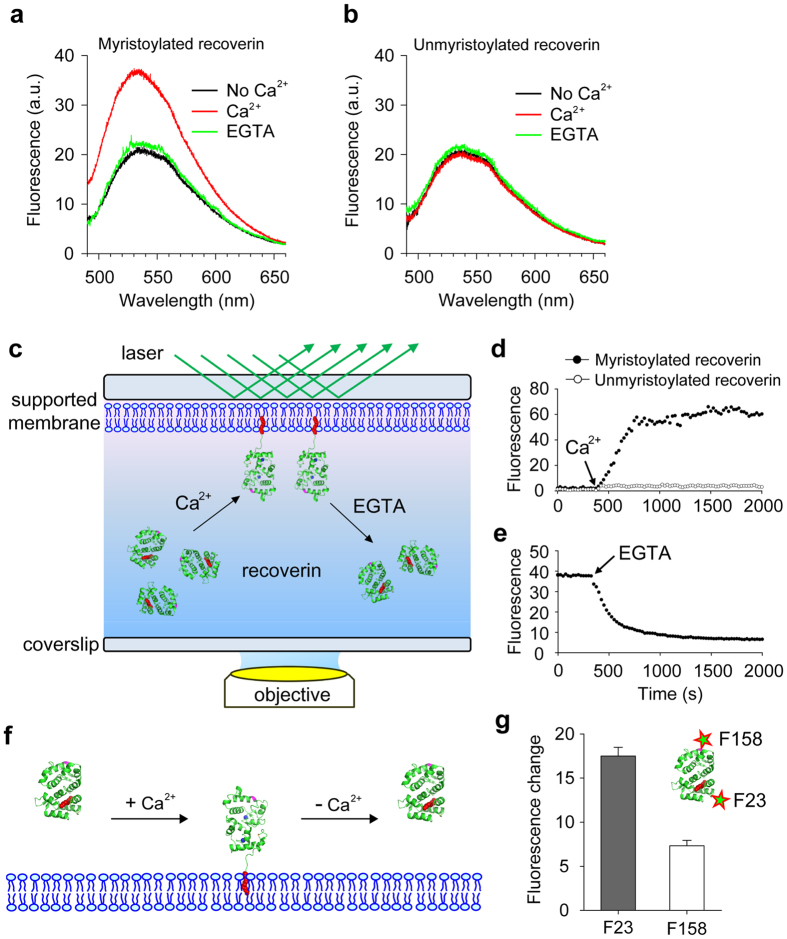
Figure 2. Ca2+-dependent binding of myristoylated recoverin to membranes.
NBD-labeled myristoylated (mRec-F23NBD) and unmyristoylated (Rec-F23NBD) versions of recoverin were used for spectrometric measurements of membrane association. Fluorescence emission spectra of 0.1 μM mRec-F23NBD (a) and Rec-F23NBD (b) were recorded in LUVs (0.1 mM total lipids) composed of PC/PE (7:3 mol:mol) in the absence (black) and presence (red) of 1 mM Ca2+. 2 mM EGTA was added after 1 h incubation of recoverin with 1 mM Ca2+ (green). (c) Schematic of TIRF microscopy approach used to monitor the association and dissociation of recoverin to supported membranes. (d) Binding of 0.1 μM mRec-F23NBD and Rec-F23NBD to supported membranes composed of PC:PE (7:3 mol:mol). Mean fluorescence intensity over time, indicating recoverin binding to the membrane after addition of 1 mM Ca2+. (e) Dissociation of mRec-F23NBD from supported membranes. Mean fluorescence intensity over time, indicating recoverin dissociation from the membrane after addition of 2 mM EGTA. (f) Schematic diagram of recoverin-membrane interaction. The myristoyl group of recoverin is exposed by the Ca2+ binding and inserts into the membranes. Such recoverin binding can be dissociated from the membrane by Ca2+ removal. (g) Position-dependent NBD fluorescence intensity of membrane-bound recoverin. Fluorescence changes of mRec-F23NBD and mRec-F158NBD by Ca2+ addition were measured. Data are representative of three experiments in a, b, d, and e, and mean ± s.d. of triplicates in g.

