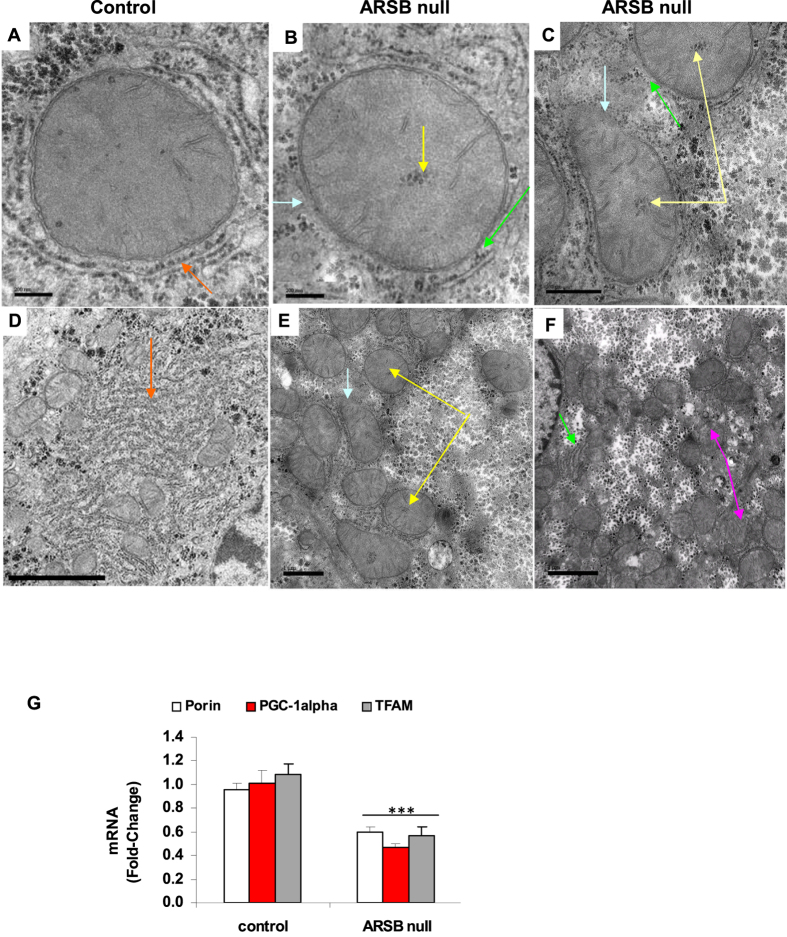
Figure 5. Ultrastructural characteristics and mitochondrial gene expression in hepatic tissue from ARSB-null mice.
(A) Transmission electron micrographs (EM) of a mitochondrion from the control C57BL/6J mouse liver shows intact mitochondrial membranes and extensive surrounding endoplasmic reticulum (orange arrow) (bar = 200 nm; original magnification = 103,000). (B) In contrast, mitochondrion from ARSB-null mouse liver shows unusual central inclusions (yellow arrow), disruption of the surrounding endoplasmic reticulum (ER; green arrow), and discontinuity of the mitochondrial membranes (blue arrow) (bar = 200 nm). (C) EM shows marked disruption of the mitochondrial membranes (blue arrow) and prominent central inclusions (yellow arrow), as well as disarray of the surrounding ER (green arrow) (bar = 500 nm). (D) EM of control mouse hepatic tissue shows abundant mitochondria and endoplasmic reticulum (orange arrow), without opacification of the surrounding cytoplasm (bar = 2 μm; original magnification = 15,000). (E) The ARSB-null mice mitochondria show frequent central inclusions (yellow arrow) and disruption of the mitochondrial membranes (blue arrow) (bar = 1 μm). (F) The ARSB-null hepatic cells show extensive opacification of the surrounding cytoplasm, loss of ER (green arrow) and disrupted mitochondria (pink arrow) (bar = 1 μm). (G) mRNA levels of three mitochondrial genes were determined by QPCR. The genes porin, TFAM (Transcription Factor A, mitochondrial) and PGC (peroxisome proliferator-activated receptor-gamma coactivator)-1α were significantly reduced in hepatic tissue of ARSB null mice. [AF = ARSB-null female; AM = ARSB-null male; ARSB = arylsulfatase B; CF = control female; CM = = control male; EM = electron micrograph; ER = endoplasmic reticulum; MMP = mitochondrial membrane potential; TEM = transmission electron microscopy]

