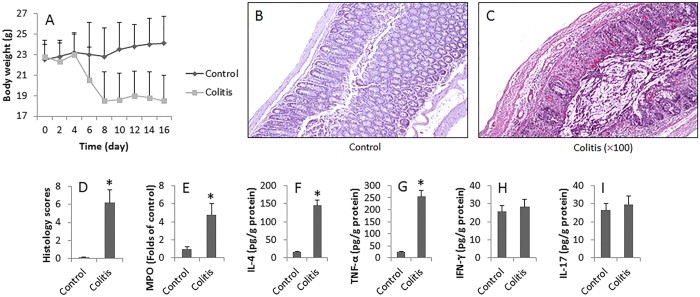
Figure 2. Induction of allergen-related colitis.
BALB/c mice (12 mice/group) were treated with OVA/CT as described in Fig. 1. (A) The curves indicate the body weight of the mice. (B,C) The photomicrographs show the histology of the mouse colon (magnification = ×100). (D) The bars show the histology scores of (B,C). (E–J) The bars indicate the levels of MPO (E) IL-4 (F) TNF-α (G) IFN-γ (H) and IL-17 (I) in the protein extracts of colon tissue. Data are presented as mean ± SD. *p < 0.01, compared with the control group. Samples from individual mice were processed separately.

