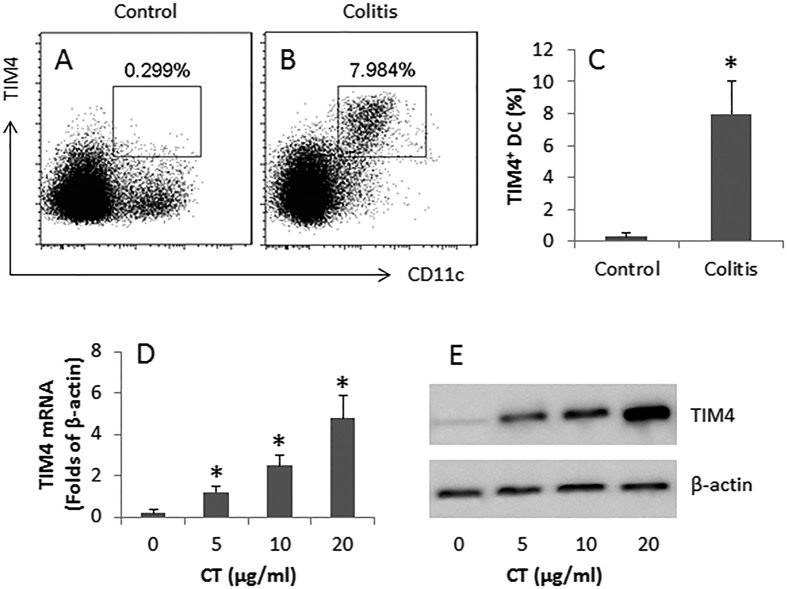
Figure 5. CT increases TIM4 expression in colon DCs.
(A,B) the gated flow cytometry dot plots indicate the frequency of TIM-4+ DCs in the colon mucosa of mice (n = 6 per group) with or without colitis. (C) the bars indicate the summarized data of (A,B). (D) the bars indicate the TIM4 mRNA levels in BMDCs after stimulated with CT in the culture for 48 h at graded doses (denoted on the X axis). (E) the immune blots indicate the protein levels of TIM4 in BMDCs after stimulating with CT in the culture. Samples from individual mice were processed separately. Data of bars are presented as mean ± SD. *p < 0.01, compared with the control group (C) or the dose “0” group (D). Data of (D,E) are representatives of 3 independent experiments. The full length gel graphs are presented in the relevant information.

