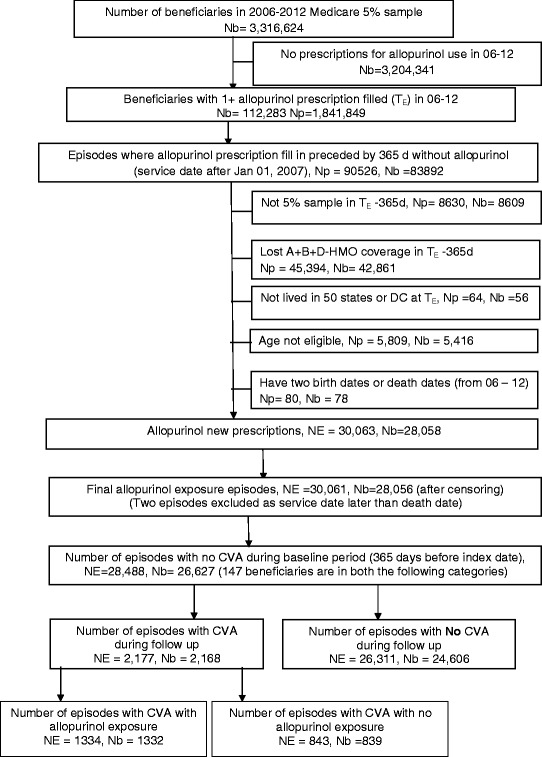
Fig. 1.

Flow-chart of study cohort of incident allopurinol users from 2006–2012 for baseline of 365 days. Legend: NE, number of episodes; Nb, number of beneficiaries; Np, number of prescriptions

Flow-chart of study cohort of incident allopurinol users from 2006–2012 for baseline of 365 days. Legend: NE, number of episodes; Nb, number of beneficiaries; Np, number of prescriptions