Fig. 1.

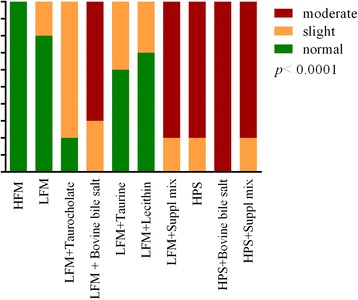
Number of samples in each diet group classified by severity of inflammatory changes in the distal intestine. The P value for the Chi-square test is given

Number of samples in each diet group classified by severity of inflammatory changes in the distal intestine. The P value for the Chi-square test is given