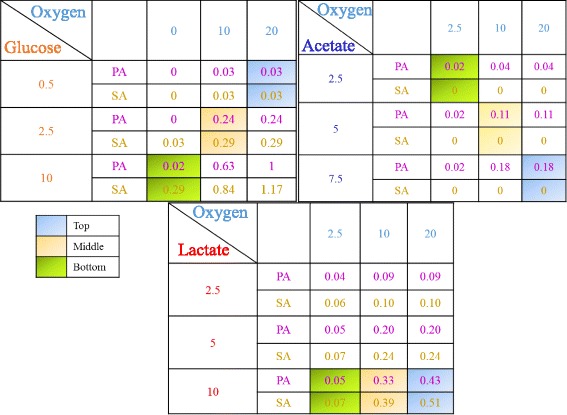
Table 4.
Flux balance analysis of P. aeruginosa (PA) and S. aureus (SA) single species metabolism. Growth rates (h−1) are shown for different combinations of substrate uptake rates (mmol/gDW/h)

Representative uptake rates at the top, middle and bottom of a typical simulated two species biofilm are colored coded
