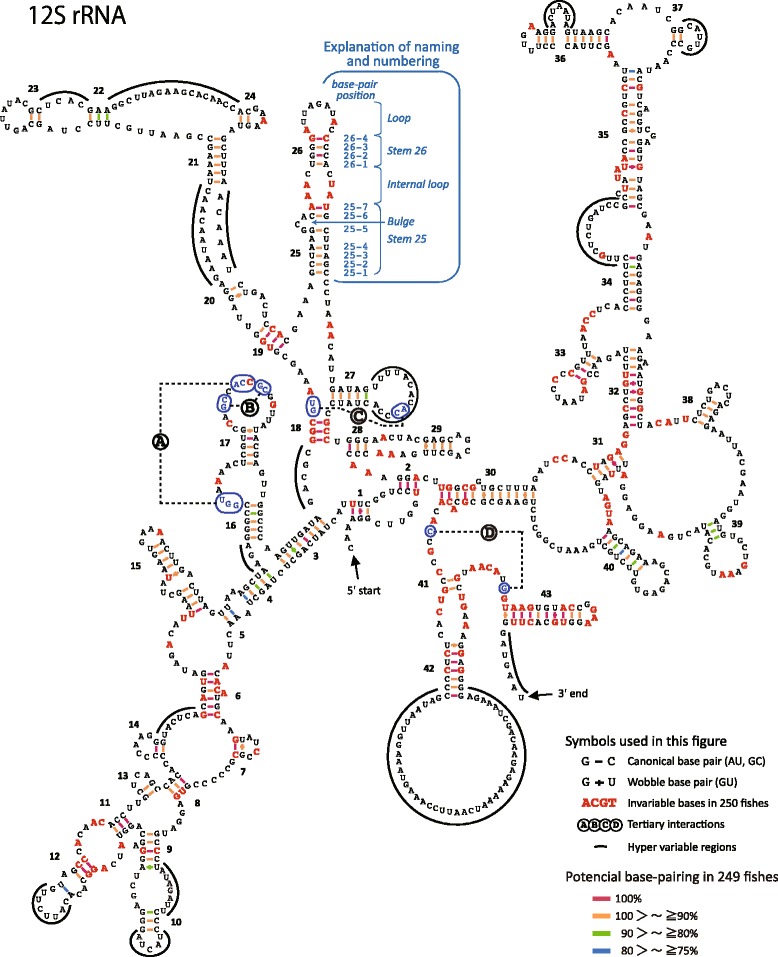
Fig. 6.

Secondary structure model of 12S ribosomal RNA genes exhibiting variation among the 250 fishes. Standard sequence is represented by that of Sillago japonica. Numerals refer to the stem code number. Bold red letters indicate invariable bases in the 250 fishes. Frequencies of Watson-Crick and wobble base pairing observed in 250 fishes are shown with color-coded bars and crosses, respectively. Dotted lines named A–D refer to tertiary interactions. Hypervariable regions are indicated by thick lines around the sequences
