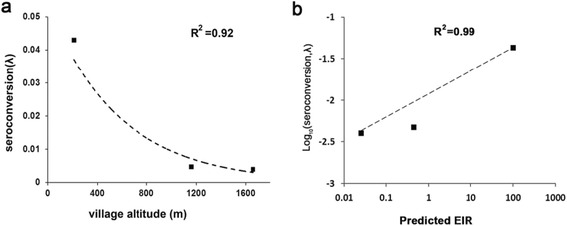
Fig. 7.

Association between altitude or EIR and rate of seroconversion from M.RCAg-1 seronegative to seropositive. a Plot of estimated seroconversion rates(λ) (calculated as for Fig. 6) against altitude. The line and R2 value are for the least-squares fitted functionλ = 0.0534e-0.002h, where h is the altitude in m. b Plot of log(λ) against log (predicted EIR). The least-squares fitted line has the equation Log10(λ) = 0.01*Log10(EIR)-2.3653. EIR was calculated from the equation log(EIR) = 2.523–0.0025 * altitude [35]
