
Figure 2.
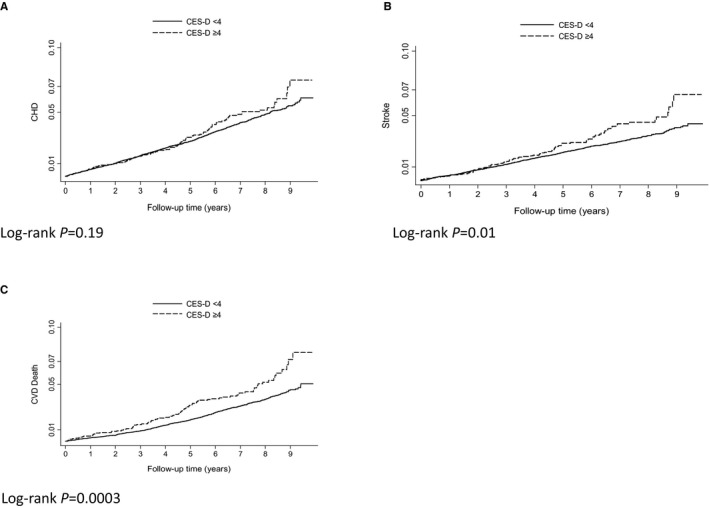
Kaplan–Meier graphs of depression and CVD events and deaths on or before December 31, 2012. Kaplan–Meier curves and log‐rank P values for the relationship between depressive symptoms and fatal and nonfatal CHD (A), fatal and nonfatal stroke (B), and CVD death (C). CES‐D indicates Center for Epidemiologic Studies Depression Scale; CHD, coronary heart disease; CVD, cardiovascular disease.