
Figure 4.
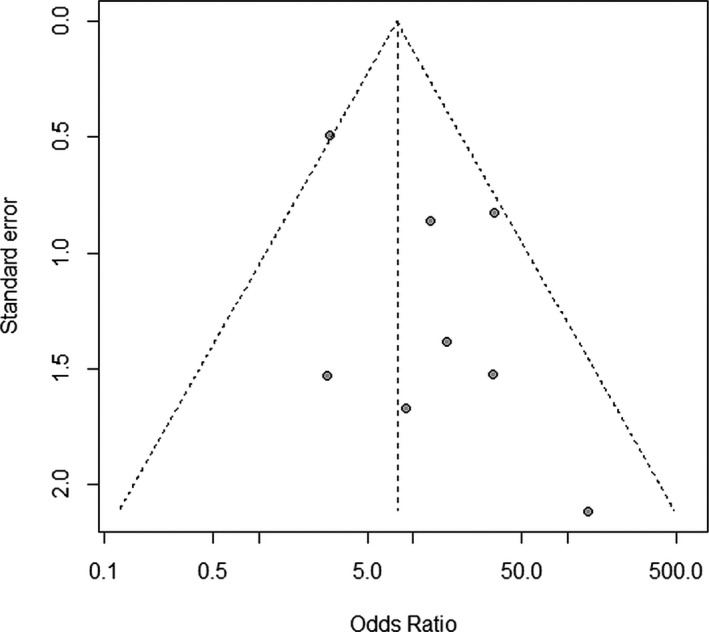
Funnel plot to evaluate for publication bias. Individual study effect sizes expressed as odds ratios are shown on the x‐axis and each study's standard error is shown on the y‐axis. Larger and more precise studies are plotted at the top, near the combined (pooled) odds ratio, whereas smaller and less precise studies will show a wider distribution below. If there is no publication bias, the studies would be expected to be symmetrically distributed on both sides of the pooled odds ratio line. In the case of publication bias, the funnel plot may be asymmetrical, since the absence of studies would distort the distribution on the scatter plot.