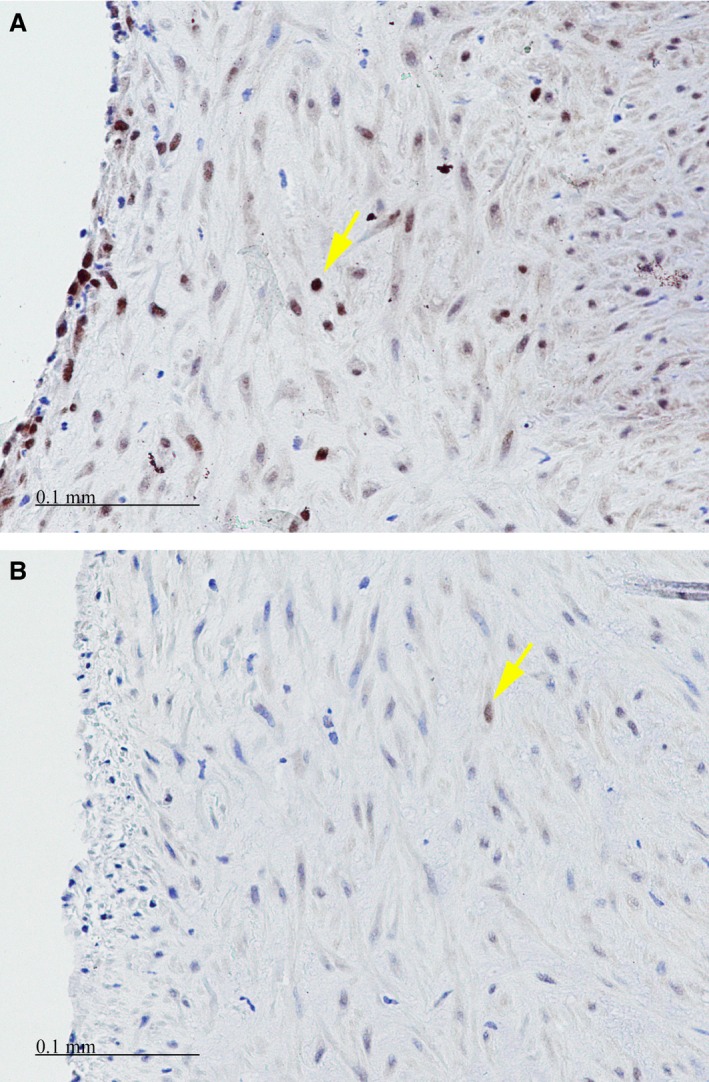
Figure 8.

Proliferating cell nuclear antigen stain demonstrating a greater number of proliferating cells within the intima of control (A) versus photochemical tissue passivation–treated (B) vein grafts. Positive cells (yellow arrows) show a brown nuclear staining. Scale bar=0.1 mm.
