
Figure 1.
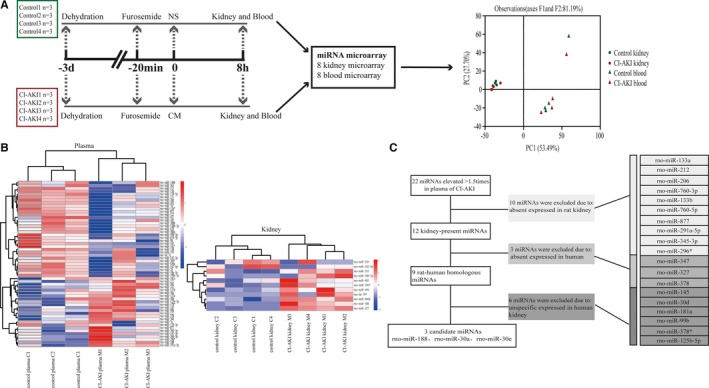
Selection of candidate circulating miRNAs as early biomarkers for CI‐AKI in rats. A, Global miRNA expression profiles of kidney and plasma in CI‐AKI and control rats by miRNA microarrays. Principal component analysis (PCA) revealed that the hybridization results of 2 plasma samples (1 from the CI‐AKI group and 1 from the control group) were significantly different from the other plasma samples. These 2 components explained 81.19% of the variability. B, Hierarchical clustering analysis of dysregulated miRNAs (with a fold change >1.5) in plasma and kidney samples. The relative miRNA expression is depicted according to the color scale shown on the right. Red indicates upregulation and blue, downregulation. C, Diagram of the strategy for identifying candidate miRNAs. See Results for details. CI‐AKI indicates contrast‐induced acute kidney injury; CM, contrast medium; miRNA, microRNA; NS, normal saline; PCA, principal component analysis.