
Figure 3.
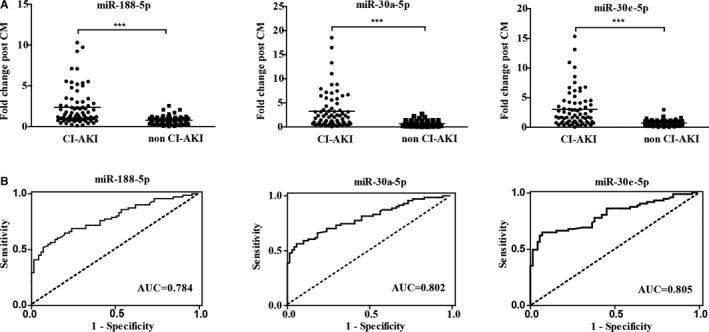
Evaluation of candidate circulating miRNAs in CI‐AKI patients. A, The plasma levels of the three candidate miRNAs in 71 CI‐AKI patients and 71 matched controls without CI‐AKI by RT‐qPCR. Blood samples were obtained at baseline and 4 to 6 hours post CM exposure. Individual value plots represent the relative change of miRNA levels compared with baseline in each CI‐AKI patient (left) and non‐CI‐AKI patient (right). A crossbar on each plot indicates the mean expression level for each group. ***P<0.001. B, Discrimination potential of candidate circulating miRNAs. Receiver operating characteristics (ROC) curves were drawn with the data of fold change of plasma microRNAs from 71 CI‐AKI patients and 71 matched controls. The dashed line indicates “random guess” diagonal line. AUC indicates area under the curve; CI‐AKI, contrast‐induced acute kidney injury; CM, contrast medium; miRNA, microRNA; RT‐qPCR, reverse transcription quantitative real‐time polymerase chain reaction.