
Fig. 8.
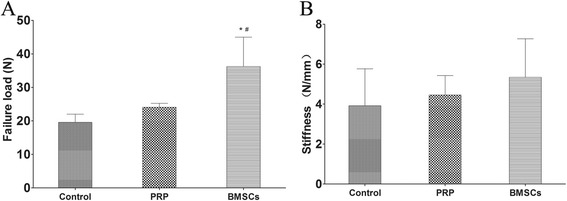
Biomechanical test results: failure load (a) and stiffness (b). *p < 0.05 vs. control group; # p < 0.05 vs. the PRP group
Official websites use .gov
A
.gov website belongs to an official
government organization in the United States.
Secure .gov websites use HTTPS
A lock (
) or https:// means you've safely
connected to the .gov website. Share sensitive
information only on official, secure websites.
Biomechanical test results: failure load (a) and stiffness (b). *p < 0.05 vs. control group; # p < 0.05 vs. the PRP group