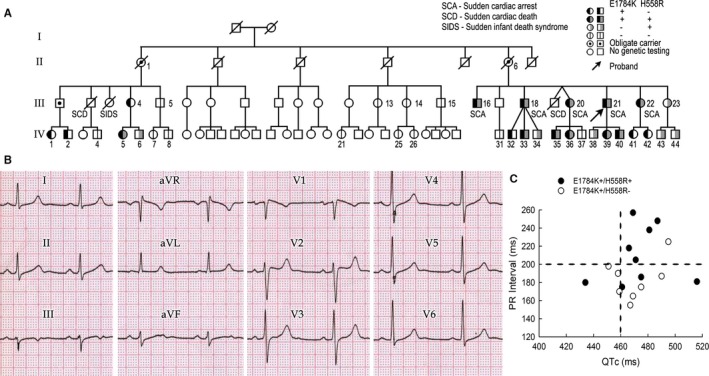
Figure 1.

Clinical summary of the affected family. A, Pedigree of the family. B, Baseline ECG of the index patient (proband), who is positive for SCN5A‐E1784K and H558R. C, PR interval vs QTc among SCN5A‐E1784K carriers. Upper limit of normal values is indicated by dotted lines.
