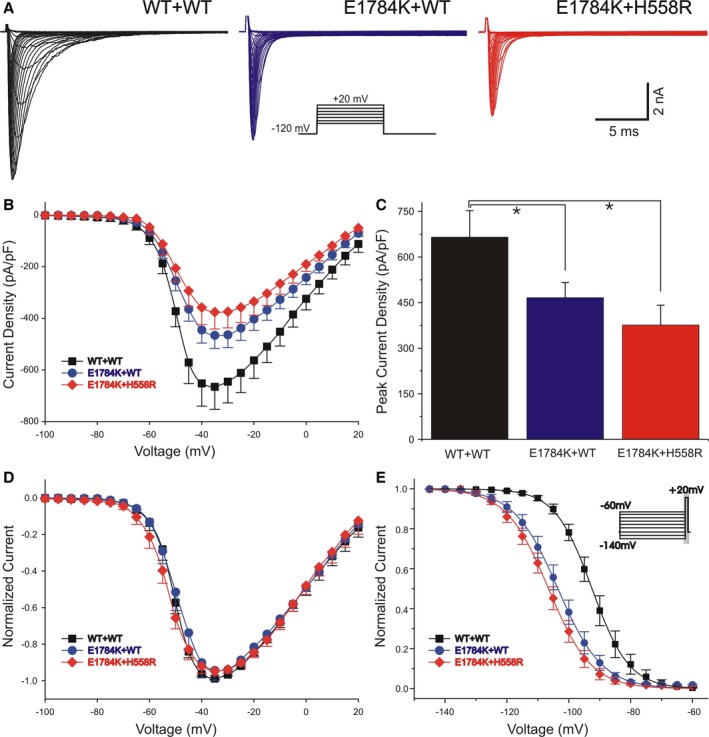
Figure 5.

Functional expression studies evaluating the characteristics of IN a for WT+WT, E1784K+WT, and E1784K+H558R. A, Whole‐cell current traces from representative experiments of 3 groups. The voltage‐clamp protocol is shown as the inset. IN a was elicited by depolarizing pulses ranging from −90 mV to +20 mV in 5‐mV increments with a holding potential of −120 mV. B, Current–voltage relationship for WT+WT (squares, n=33), E1784K+WT (circles, n=18), and E1784K+H558R (diamonds, n=11). C, Summary of maximum peak IN a density of the 3 groups (*P<0.05). Peak E1784K+WT and E1784K+H558R current at −35 mV was smaller by 29.97% and 43.50% relative to WT+WT, respectively (P=0.043 and P=0.032). D, Normalized peak current–voltage relationships of the 3 groups. E, Steady‐state inactivation for WT+WT (squares, n=22), E1784K+WT (circles, n=7), and E1784K+H558R (diamonds, n=12) using the standard protocol indicated in the diagram. Peak current was normalized to their respective maximum values and plotted against the conditioning potential. Data were fitted by Boltzman function. For values see text.
