
Figure 6.
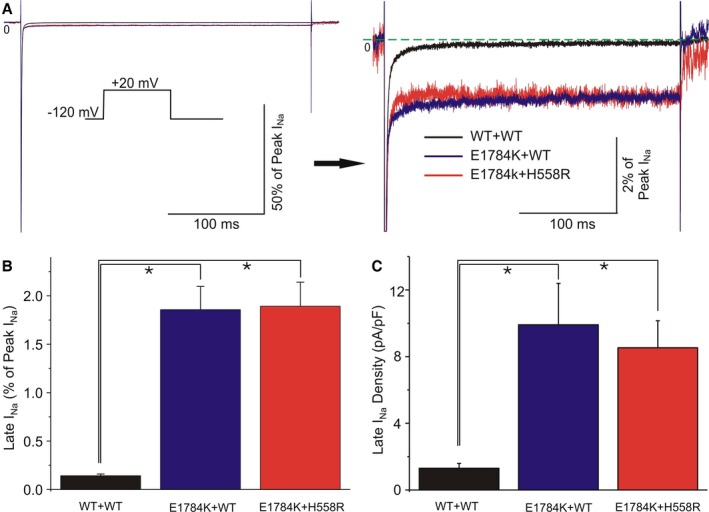
Functional expression studies evaluating the characteristics of late IN a for WT+WT, E1784K+WT, and E1784K+H558R. A, Representative TTX‐sensitive sodium current traces obtained by subtraction, recorded during a 300‐ms depolarization to −20 mV from −120 mV (left panel). Amplified traces showing late INa (right panel). B and C, Bar graph of relative late INa (% of peak INa) and late INa density (pA/pF) among 3 groups. Statistically significant differences (*P<0.05) were observed between E1784K+WT/E1784K+H558R and WT+WT in both panels (n=7, 10, 22 for each group). No statistically significant difference was observed between E1784K+WT and E1784K+H558R. For values see text.