
Figure 1.
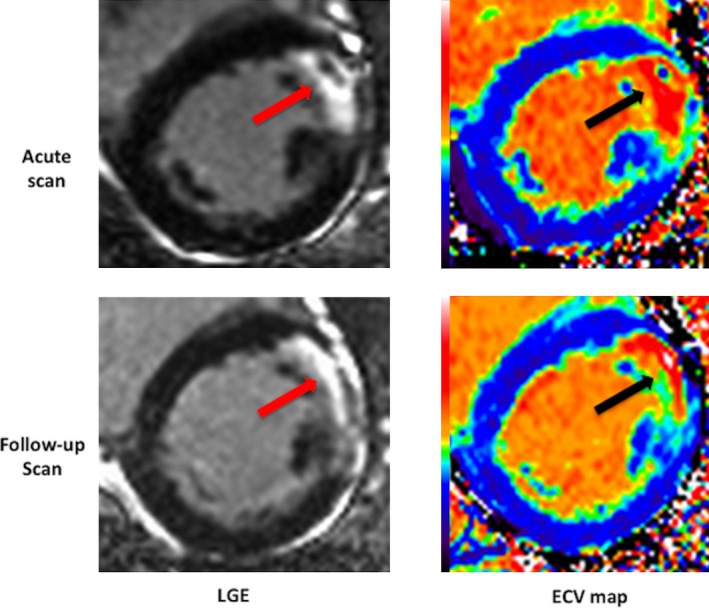
Example of LGE images and ECV maps of an acute and follow‐up scan of a patient with an anterior STEMI. The arrows show the area of LGE with a core of MVO on the acute scan and the corresponding chronic LGE and ECV. ECV indicates extracellular volume fraction; LGE, late gadolinium enhancement; MVO, microvascular obstruction; STEMI, ST‐segment elevation myocardial infarction.