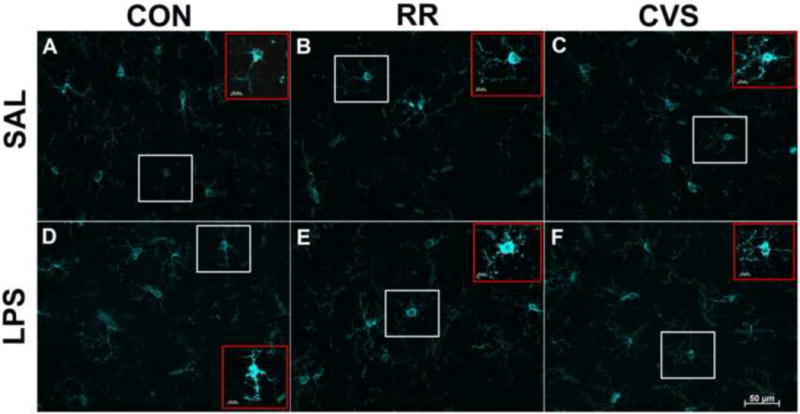
Figure 4.

Representative 40× images of Iba-1 positive cells in the IL PFC, layers 5/6. White boxes depict examples of cells selected for analysis. Red boxes (insets) depict the same respective cell per figure with enhanced zoom and contrast, showing soma perimeter with red dashed line. Scale bar in inset represents 20μm. In the LPS treated groups (D–F), only the RR LPS group (E) had increased soma size relative to the RR SAL group (B). The CON SAL (A) did not differ from CON LPS (D), and CVS SAL (C) did not differ from CVS LPS (F).
