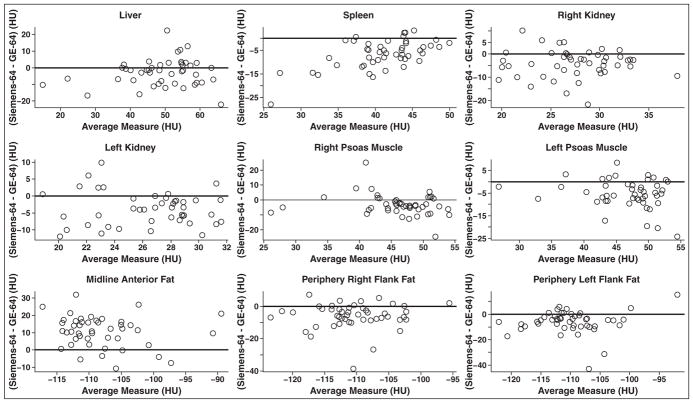
Fig. 3.
Scatterplot graphs of average Hounsfield unit measurements obtained by both Definition AS Plus (Siemens Healthcare) and Volume CT (GE Healthcare) 64-MDCT scanners compared to difference in Hounsfield unit measurements, calculated as Definition AS Plus value minus Volume CT value, between two scanners for each anatomic location studied. Black solid line is placed at difference of 0 HU.

