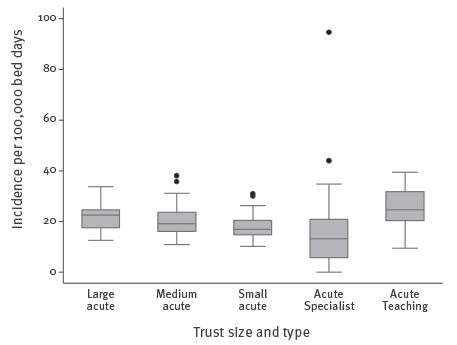
Figure 4.
Box-and-whisker plots showing hospital-onset Escherichia coli bacteraemia annual rates, by Trust size and type, England, April 2012–March 2014
The boxes represent the 25th and 75th percentiles; the median line is present within the box. The lower and upper whiskers represent the 5th and 95th percentiles. Outliers are represented by dots.