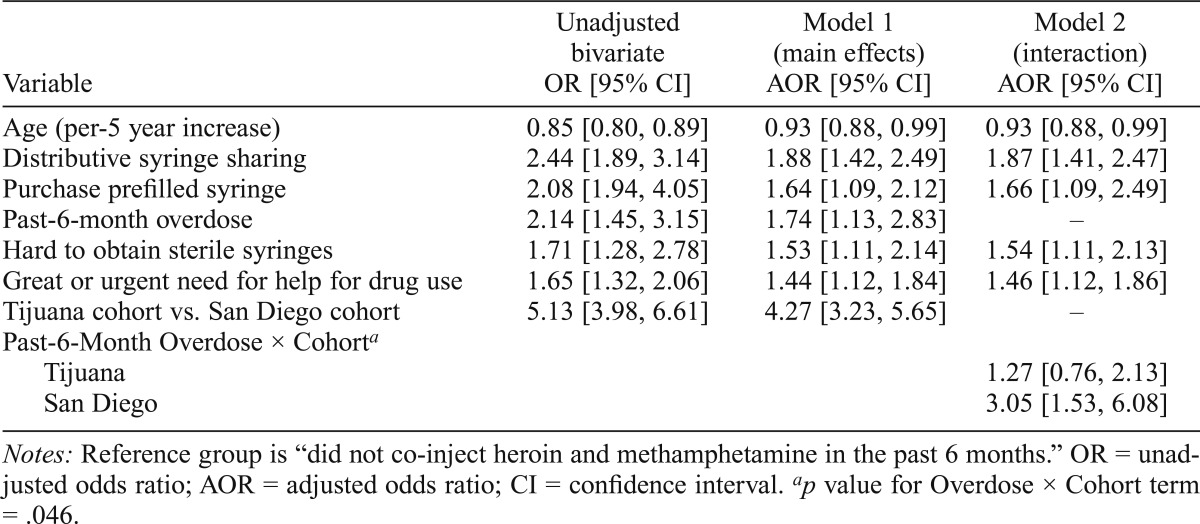
Table 3.
Multivariable analysis of factors associated with heroin–methamphetamine co-injection in the past 6 months among persons who inject drugs in San Diego and Tijuana (n = 1,224)
| Variable | Unadjusted bivariate OR [95% CI] | Model 1 (main effects) AOR [95% CI] | Model 2 (interaction) AOR [95% CI] |
| Age (per-5 year increase) | 0.85 [0.80, 0.89] | 0.93 [0.88, 0.99] | 0.93 [0.88, 0.99] |
| Distributive syringe sharing | 2.44 [1.89, 3.14] | 1.88 [1.42, 2.49] | 1.87 [1.41, 2.47] |
| Purchase prefilled syringe | 2.08 [1.94, 4.05] | 1.64 [1.09, 2.12] | 1.66 [1.09, 2.49] |
| Past-6-month overdose | 2.14 [1.45, 3.15] | 1.74 [1.13, 2.83] | – |
| Hard to obtain sterile syringes | 1.71 [1.28, 2.78] | 1.53 [1.11, 2.14] | 1.54 [1.11, 2.13] |
| Great or urgent need for help for drug use | 1.65 [1.32, 2.06] | 1.44 [1.12, 1.84] | 1.46 [1.12, 1.86] |
| Tijuana cohort vs. San Diego cohort | 5.13 [3.98, 6.61] | 4.27 [3.23, 5.65] | – |
| Past-6-Month Overdose × Cohorta | |||
| Tijuana | 1.27 [0.76, 2.13] | ||
| San Diego | 3.05 [1.53, 6.08] |
Notes: Reference group is “did not co-inject heroin and methamphetamine in the past 6 months.” OR = unadjusted odds ratio; AOR = adjusted odds ratio; CI = confidence interval.
p value for Overdose × Cohort term = .046.

