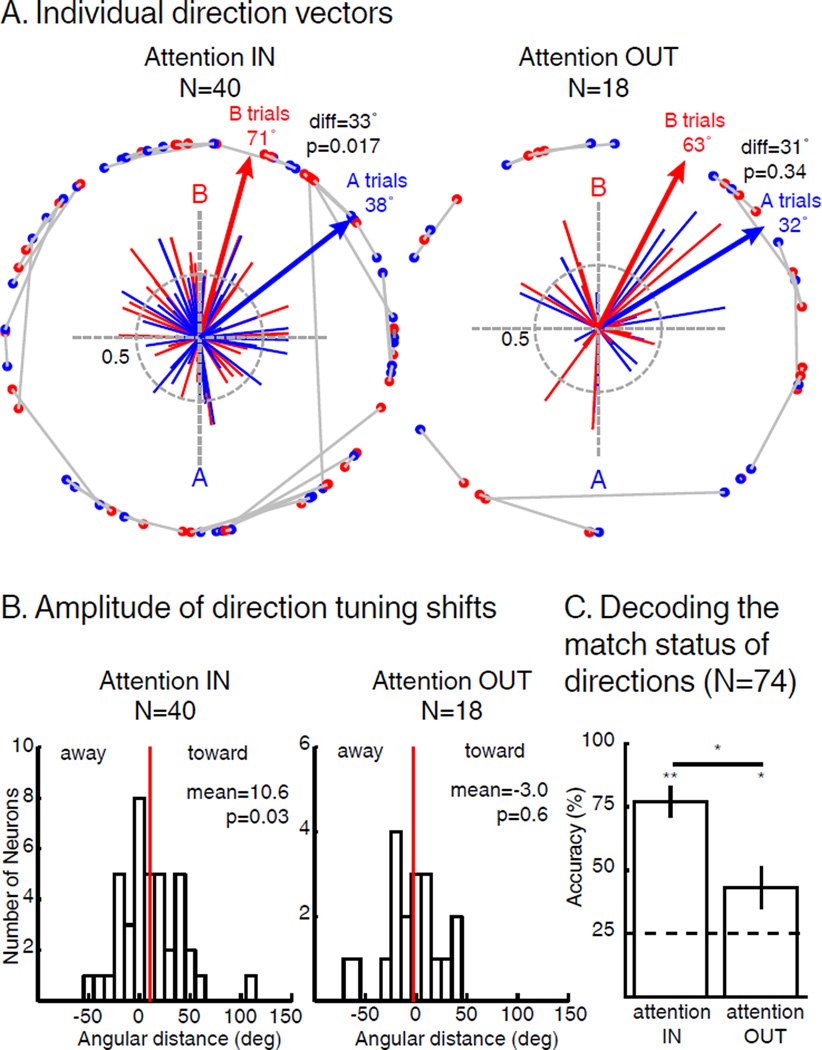
Figure 5.
Impact of SBA and FBA on direction tuning of direction selective neurons. (A) Individual direction vectors during AttIN (N=40, permutation test, p<0.05) and AttOUT (N=18, permutation test, p<0.05). Solid lines represent direction vectors of each neuron during either sample A (blue) or sample B (red) trials. Blue and red arrows represent the sum of blue and red direction vectors (respectively). Blue and red dots paired by grey lines represent unitary projections of each individual vectors during A and B trials respectively. diff: angular distance between sample A and sample B vectors. (B) Angular distance between the preferred direction of each neuron during sample A and B trials. Sign of the angular distance has been normalized so that positive and negative values represent respectively shifts toward and away the attended direction. Red lines represent the mean of the distributions (T-Test). (C) Accuracy of an SVM classifier to decode the match status of direction A and B during both AttIN (left) and AttOUT (right) conditions (permutation test, * p<0.05, ** p<0.01). Dotted line: chance level. Error bars represent standard deviation to the mean.

