Figure 7.
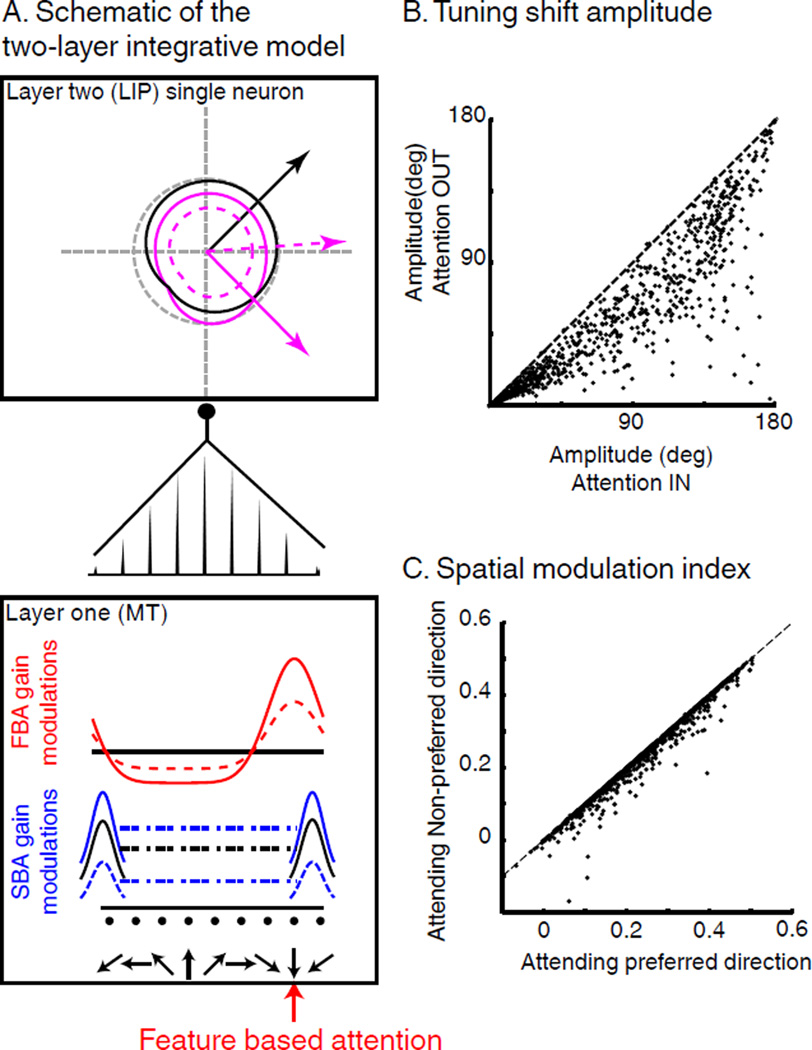
Two-layer integration model. (A) Schematic of the model. Feature selectivity of L2 neurons (top box) comes from the linear integration of population of L1 neurons (bottom box) and depends on the distribution of synaptic weights (middle). Black curves represent native tuning (no attention). For clarity, we only illustrate the tuning curves of the L1 neurons located on the extremities of the axis. Blue and red lines represent respective multiplicative gain factors of SBA and FBA on L1 neurons. Purple lines represent the joint effect of FBA and SBA on L2 neuron’s direction tuning. Full lines represent AttIN conditions. Dotted lines represent AttOUT. (B) Effect of SBA on the amplitude of feature-tuning shifts. (C) Effect of direction tuning of L2 neurons on the amplitude of SBA modulations.

