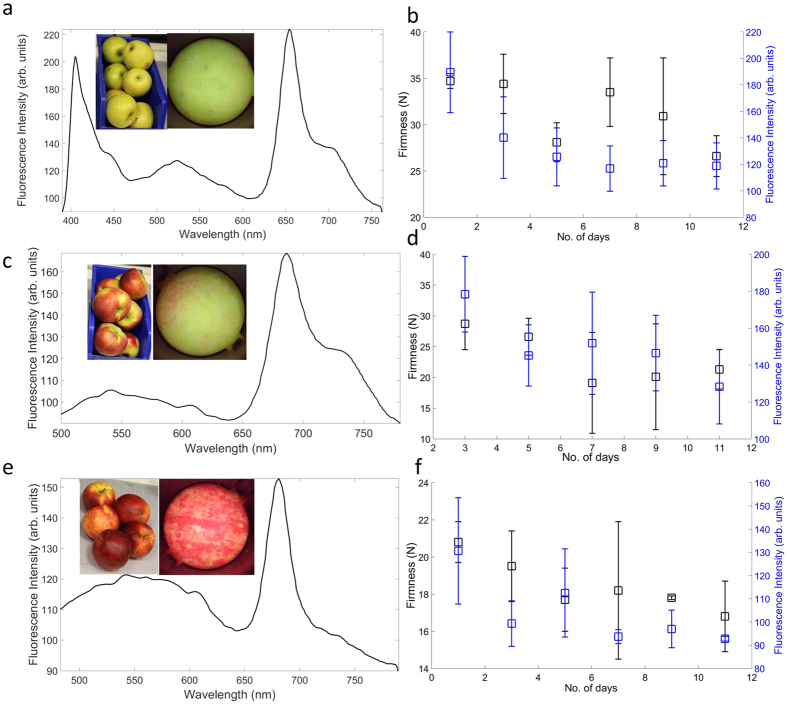
Figure 5. Results of fluorescence measurements from the three apple varieties.
Typical fluorescence spectrum for various samples (a) Golden delicious, (c) McIntosh and (e) Empire, respectively. Evolution of firmness (black squares, left y-axis) ChlF signal (blue squares, right y-axis) over time for the varieties (b) Golden delicious, (d) McIntosh and (f) Empire, respectively. (Insets) Photographs of the samples along with a magnified image of the region that was tested.

